UPFINA's Mission: The pursuit of truth in finance and economics to form an unbiased view of current events in order to understand human action, its causes and effects. Read about us and our mission here.
Reading Time: 4 minutes
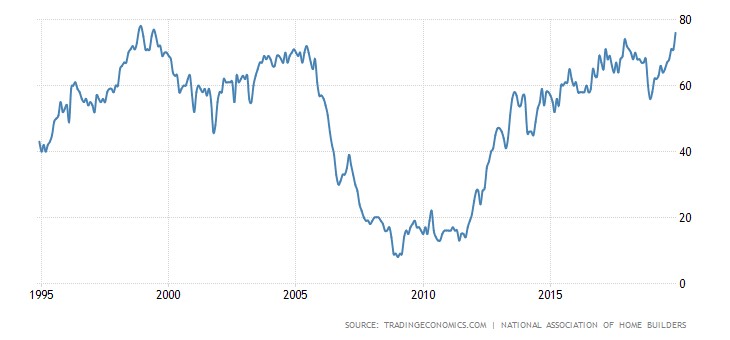
The housing market is doing really well; strong yearly growth is not just because of the weak comps. The housing market index hit a 20 year high and permits hit a new cycle high. Real residential investment growth will positively impact Q4 GDP growth for the 2nd straight quarter (following a 6 quarter negative streak). The housing market index was spectacular. It was probably too good. We’re not saying the reading was wrong, but we are saying that although home builder confidence is the highest in 20 years, there’s no evidence that this is a stronger housing market than the early 2000s, not that anyone would want a repeat of that bubble.
Specifically, in December, the single family sales index rose 5 points to 76 which beat estimates by 6 points. The present sales index increased 7 points to 84. That’s amazing, but don’t start thinking this is the best housing market in 20 years. New home sales are only a little above half the 2005 peak. The takeaway is that the housing market is ramping higher after being weak in the 2nd half of 2018 and the first half of 2019. This is due to the decline in rates, strong consumer sentiment, positive real wage growth, and low unemployment. The decline in home price growth also helped.
The 6 month expected new home sales index rose 1 point to 79. The traffic index rose 4 points to 58 which is a good sign from first time homebuyers. There was a very unusual 15 point jump in the Midwest index to 73. Usually, indexes move a few points each month. Obviously, the GM strike ended, but that was a few weeks ago. It should have helped last month’s report. The South’s index rose 2 points to 77. The Northeast and the West’s indexes fell 6 points and 2 points to 58 and 83. The Northeast has a very small impact on this report.
Cycle High In Permits
The November housing starts and permits readings were amazing. This isn’t just sentiment; it’s hard evidence that the housing market is improving quickly. Housing starts were up from 1.323 million to 1.365 million which beat estimates for 1.34 million. This was the 2nd best reading of this expansion. Permits hit a new cycle high as they rose from 1.461 million to 1.482 million which beat the consensus of 1.41 million and the highest estimate which was 1.45 million.
As the chart below shows, permits lead starts by 6 months, so new cycle highs for starts are coming.
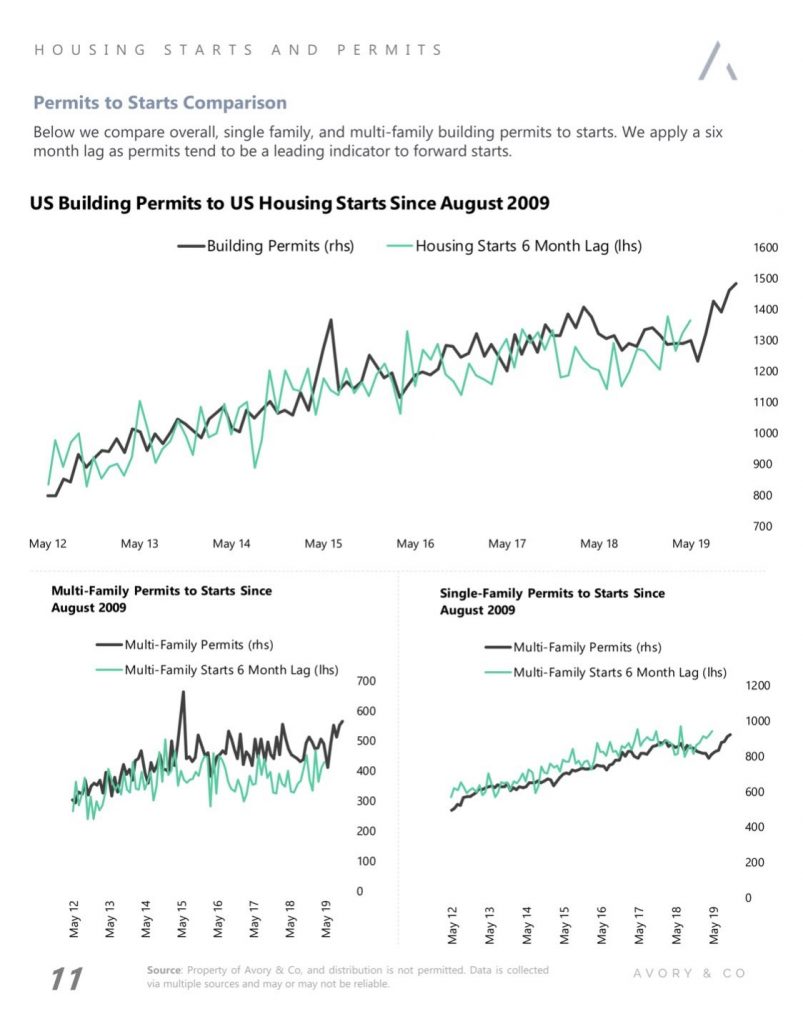
There were 938,000 single family starts and 427,000 multi-family starts. That’s 2.4% and 4.91% monthly growth. There’s no point in reviewing yearly growth because the housing market was weak in Q4 2018. The comp is too easy. It’s just like how retail sales face a very easy comp in December. Housing market data leads the economy by more than any other group of reports. The cycle peak in new home sales is a median of 28 months before the next recession. With this great report, there is no sign of new home sales peaking soon. They should be strong in Q4. The November new home sales report comes out on Monday.
Industrial Production Improves Because GM Strike Ends
Even though the November industrial production report beat estimates, it wasn’t a great reading because growth was helped by the ending of the GM strike and the easy monthly comp. This report was more of the same. The manufacturing sector is in a slowdown. It could come out of it soon based on the Markit PMI data, but there wasn’t hard evidence the recovery started in November.
Monthly industrial production growth was 1.1% which beat estimates for 0.9%. That followed -0.9% growth. Manufacturing’s 1.1% growth was more impressive because it had a tougher comp (-0.7%), but it was helped more by the ending of the GM strike. Excluding the 12.4% increase in motor vehicle and parts production due to the end of the strike, monthly industrial production growth was 0.5% and manufacturing production growth was 0.3%. That’s actually not that great considering the weak comps.
As you can see from the chart below, the capacity to utilization rate, increased from 76.6% to 77.3% which missed estimates by a 0.1%.
With the help of the ending of the GM strike, yearly industrial production growth improved from -1.3% to- 0.8% and manufacturing production growth improved from -1.7% to -0.8%. The comp was about the same for manufacturing and was tougher for industrial production. Yearly industrial production growth rose from 2% to 2.5% in November of last year. Hence, the 2 year growth stack was up 1%. Both comps will get easier in the coming months since the manufacturing sector had a bad 2019. Just because of easier comps, there might be positive growth next year. Adding in the global economic acceleration, makes the potential for positive growth stronger.
Mining production growth was 2% which fell from 3%. Unlike oil prices, mining production still has a tough comp as growth was 13.1% last year. Starting in February of next year, the comps will get easier. Mining production not crashing like it did from 2015-17 is the reason why this manufacturing slowdown isn’t as deep as the last one. It’s wider though. Utilities production was down 4.1% yearly. It had a very tough comp of 6.1%. Monthly growth was 2.9% as it had an easy comp of -2.4%.
Conclusion
The housing market is doing really well as home builder confidence was the best in 20 years and permits hit a cycle high. Based on the leading nature of new home sales in previous cycles, there might not be a recession for another 2 years. The caveat is, don’t base a macroeconomic conclusion on any one indicator. The industrial production report wasn’t great even though monthly growth beat estimates. That being said, the Markit survey shows sentiment is improving. Plus, less anxiety from a phase one of the trade deal might help. The global cyclical upturn and easy comps should make for consistently positive yearly industrial and manufacturing production growth next year.
Have comments? Join the conversation on Twitter.
Disclaimer: The content on this site is for general informational and entertainment purposes only and should not be construed as financial advice. You agree that any decision you make will be based upon an independent investigation by a certified professional. Please read full disclaimer and privacy policy before reading any of our content.


