UPFINA's Mission: The pursuit of truth in finance and economics to form an unbiased view of current events in order to understand human action, its causes and effects. Read about us and our mission here.
Reading Time: 4 minutes
The yield curve has steepened very quickly in the first half of December. As you can see from the chart below, the difference between the 10 year yield and the 2 year yield has gone from 14 basis points on November 27th to 29 basis points which is near the highest since November 2018.
The yield curve was only inverted for 3 days. The enticing wait for the yield curve to invert and then precede a recession was highly anticlimactic as there has been no recession. The median Q4 GDP growth estimate is 1.9% which is exactly what the Fed sees as the long term average growth rate.
We have stated the inversion was more about pricing in Fed policy than preceding a recession. Normally, there is a recession as the curve quickly normalizes. It’s still relatively flat, but if it continues on this steepening path, there would be normally a recession. However, there is no evidence of a recession occurring soon. Currently, the curve is steepening because the 10 year yield is rising due to increased nominal growth expectations. The 2 year yield is being suppressed by the fact that Powell has stated he needs to see sustained high inflation for the Fed to raise rates. That explains why there is a 1.1% chance of a hike next year. Without hikes, the 2 year yield won’t increase.
Improved (Flash) Markit PMI
The flash December Markit PMI hit a 5 month high as you can see from the chart below. This wasn’t a good report on an absolute basis as it’s consistent with just 1.5% GDP growth. However, it was good on a rate of change basis as it signals the slowdown could be ending.
The Chief Business Economist at IHS Markit said in the comment section of this report, “Importantly, however, the welcome signs of improvement help to ward off recession risks and should keep the Fed on hold in the coming months. The upward trajectory in the surveys support our expectations that the US economy is on course to see another year of above potential GDP growth of approximately 2.2% in 2020.” Above average growth is music to the ears of the stock market which has been pricing in a recovery for the past few weeks. The S&P 500 finally breaking out significantly higher than the January 2018 peak symbolizes that the slowdown is over.
Specifically, the composite PMI was up from 52 to 52.2. This time the improvement came from the services sector. The manufacturing PMI is still slightly higher though. The services index was up from 51.6 to 52.2 which was also a 5 month high. The manufacturing PMI, which was much better than the ISM PMI in November, fell 0.1 to 52.5. The output index was down from 53.7 to 52.4. Within the services index, new order growth hit a 5 month high and export orders ended a 4 month streak of declines. Employment rose marginally. Markit reports have been way too bearish on the labor market compared to actual BLS reports. 1 year output expectations increased to the highest level since June. Within manufacturing, new orders increased, but at a slower rate. Employment increased and 1 year expectations were also the best since June.
Fund Managers See A Recovery
Earlier in the year, the Bank of America investor sentiment polls showed many fund managers forecasting a recession and holding excess cash. Things have changed considerably. Managers have been forced to chase the market higher. This change of heart has helped catalyze the rally in the past few months. You can see in the chart below, there has been a big change in the net percentage of fund managers saying global profits will improve.
The yearly change in the net percentage led the yearly change in global PMIs after the last recession and after the 2011-12 slowdown. It was in line with the PMI improvement after the 2015-16 slowdown possibly because investors were worried about Brexit and the 2016 election. This time investors are ahead of the game again as the global manufacturing PMI is still down from last year. It’s showing signs of life though. The best time to own stocks is when the PMI is low and starting to increase. The worst time is when it is high and starting to fall.
Solid JOLTS, But Weak On A Rate Of Change Basis
As you can tell from the chart below, the October JOLTS report was great on an absolute basis as most reports have been in the past few quarters. That being said, hiring fell.
We watch hiring closer than openings because we’ve seen openings in excess of hiring in the past few years. Openings were up from 7.032 million to 7.267 million which beat estimates for 7.015 million and the high end of the estimate range which was 7.1 million. Yearly growth improved from -4.9% to -4.3%.
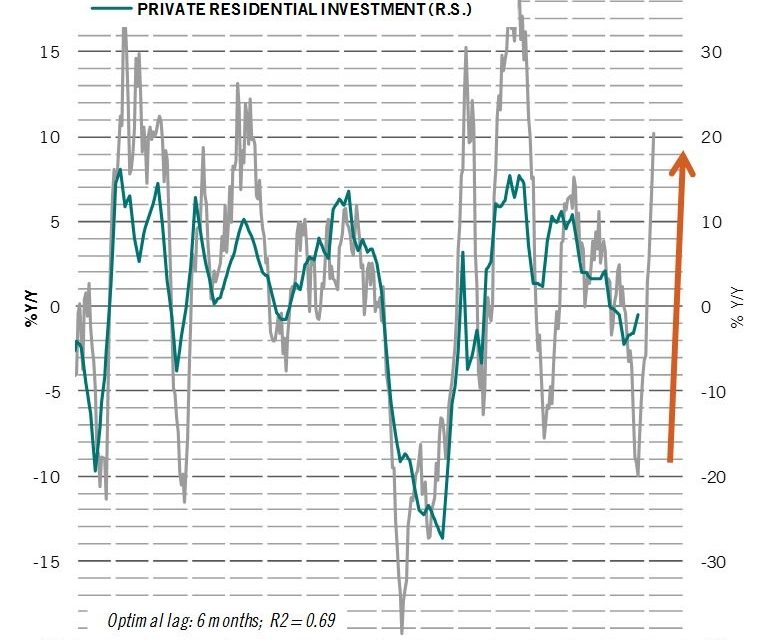
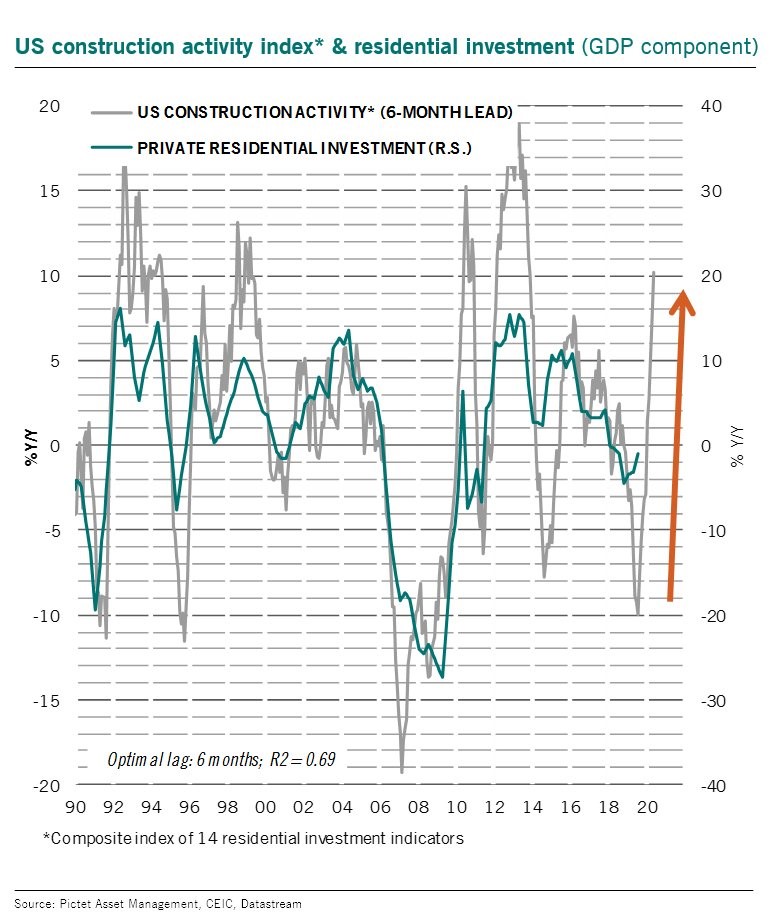
Hiring fell from 5.951 million to 5.764 million. That caused yearly growth to fall from 5% to -1.9% which was the weakest reading since June. Construction hiring was very strong as yearly growth was 33.6% which was the highest growth since January 2017. That’s in line with the strong housing starts report. As you can see from the chart below, construction activity leads private residential investment growth.
With the big spike in construction activity, it’s only a matter of time before private residential investment growth improves. Finally, the overall quits rate stayed at 2.3%. It is 0.1% below its cycle high. We want to see high quits because it signals people see opportunity in the labor market.
Conclusion
The yield curve is steepening, the stock market is rallying, the US PMI is bottoming, and expectations for global profits are increasing. That sounds like a recovery is brewing in 2020. That’s exactly what Markit suggested as it sees 1.5% GDP growth in the current quarter, but 2.2% growth next year which is above trend. The JOLTS report wasn’t amazing as hiring fell, but construction hiring was up a lot which is right in line with the improving housing market and improving construction activity.
Have comments? Join the conversation on Twitter.
Disclaimer: The content on this site is for general informational and entertainment purposes only and should not be construed as financial advice. You agree that any decision you make will be based upon an independent investigation by a certified professional. Please read full disclaimer and privacy policy before reading any of our content.


