UPFINA's Mission: The pursuit of truth in finance and economics to form an unbiased view of current events in order to understand human action, its causes and effects. Read about us and our mission here.
Reading Time: 4 minutes
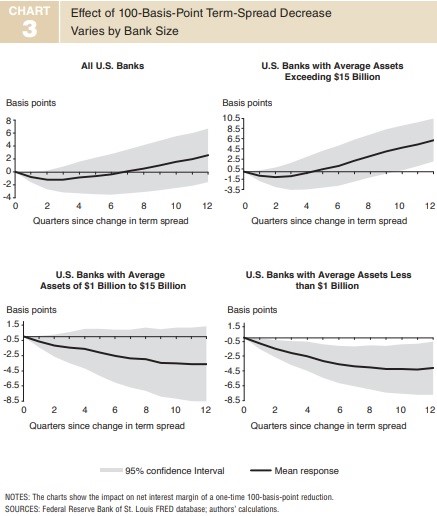
The yield curve is important because not only is it an economic indicator, it also impacts the economy. The banks’ ability to conduct normal operations where they lend long and borrow short is affected by the curve. An inverted curve lowers net interest margins, discouraging lending. When firms don’t have access to capital, economic growth halts.
Yield Curve Inversion – Bad For Banks
As you can see from the charts below, the smaller the bank is, the more it is impacted by a flattening yield curve.
If you had forecasted this recent yield curve flattening, you could have shorted the KBW small bank index and went long the XLF (as a hedge in case the curve didn’t flatten). In the past month, the KBW ETF is down 11.91%, while the XLF financials ETF is only down 4.34%. The trade might be too late to make now because the move has happened already.
The banks also don’t like the recent decline in rates. When rates rise, banks can raise rates on loans quicker than they do on savings accounts. Earlier in the cycle, even paying out no interest on savings accounts wasn’t great for them because rates were so low. The situation improved in 2018 as rates rose, but it is regressing in 2019. Banks also don’t like the increased probability of growth weakening that comes along with an inversion as it means demand for loans will weaken. One positive, is declining rates can increase demand for housing. Unfortunately, so far, demand growth is middling at best.
As you can see from the chart below, the long term historical median relative PE of the large cap bank stocks is 76%.
The current relative PE is 57% which puts the banks near the cheapest valuation relative to the market in 40 years. They were only cheaper in the early 2000s. This chart indicates when the banks get very cheap, it’s a recession warning sign. Therefore, the banks might decline less than the market if there is a recession when the yield curve steepens. It’s worth noting how regulations and banking have changed in the past 40 years. This is far from a perfect indicator that guarantees future outperformance. If the curve stays flat, banks can continue to do poorly.
The Whole Yield Curve
Parts of the yield curve have inverted especially on the near end of the curve. The bottom chart below shows all the yield curves.
As you can see, not as many have inverted this cycle as they have prior to the last 4 recessions. Another important distinction of this cycle is the curve has gradually inverted instead of sharply inverting. An inversion has been a surprise to no one as bearish commentators have been speaking of the flattening cure for years. This has been an anticlimactic event. The fact that it hasn’t come as a surprise may help banks cope with the issue. It’s very clear, there is an economic slowdown, but there aren’t many economic reports showing a recession is underway or about to start.
Yield Curve Steeping Already Underway?
Each part of the curve isn’t always in tandem as shown above. The chart above looks like an organized mess because near term action is random, while the longer term trends are easier to track. The chart below shows the difference between the 10 year yield and the 30 year yield is already starting to increase. When the curve steepens, it’s a sign of an ongoing recession.
As you can see, sometimes steeping doesn’t mean much such as in early 2015. When the difference gets close to an inversion, and then steepens, it’s more likely to mean something negative. Since the leading economic indicators are at a record high, it’s fair to say it’s a positive that the 30 year yield isn’t declining. The higher the yield increases, the more economic growth is expected. To be clear, the 30 year yield is near its year low; it just hasn’t fallen as much as the 10 year yield.
Consumer Staples Outperform After Inversions
It’s no surprise consumer staples outperform the overall market after the yield curve inverts because consumer staples flourish in a ‘risk off’ environment. As you can see from the table below, the last two times the 10 year yield fell below the 3 month yield, the XLP staples ETF outperformed the S&P 500 by 27.6% and 24.53%.
Positive Indicator
Even the relatively weak flash Markit report showed Q1 GDP growth would be above 2%. The Atlanta Fed Nowcast’s estimate is for 1.2% growth. It won’t be a fantastic quarter, but the economy won’t be in a recession. In the chart below, professional and business services temporary employment divided by all workers not in this category is compared with the civilian unemployment rate. When the temporary worker ratio rises above the civilian unemployment rate, it’s a recessionary signal. This indicator isn’t close to waving a red flag.
S&P 500 Does The Best
Just buying the S&P 500 isn’t passive investing. That’s actively picking an index you think will outperform the world. We often see the media compare the wealth growth of a successful entrepreneur with the S&P 500. Since the S&P 500 has had a spectacular 10 years, many successful entrepreneurs don’t beat its performance. However, it’s wrong to look at the S&P 500 because just buying that would be an active decision. It would be better to compare their wealth gains to the MSCI World index. No wealthy person would put 100% of their money in the S&P 500 index. It’s a straw man comparison.
Conclusion
After the yield curve inverts, the consumer staples do well. Once the curve starts to steepen, the banks do better. If you think the curve will flatten sharply, historically, shorting small cap banks could be a good trade. The yield curve may not result in a recession this cycle because the inversion was a surprise to no one. The economy probably isn’t in a recession now because the temporary help ratio is below the overall civilian unemployment rate. Plus, jobless claims are low. GDP growth of 1.2% would be just another one of the litany of weak first quarters in this expansion. Finally, buying the S&P 500 alone is far from passive investing. It has been a great strategy in the past 10 years.
Have comments? Join the conversation on Twitter.
Disclaimer: The content on this site is for general informational and entertainment purposes only and should not be construed as financial advice. You agree that any decision you make will be based upon an independent investigation by a certified professional. Please read full disclaimer and privacy policy before reading any of our content.


