UPFINA's Mission: The pursuit of truth in finance and economics to form an unbiased view of current events in order to understand human action, its causes and effects. Read about us and our mission here.
Reading Time: 4 minutes
November’s new home sales were revised lower and December’s reading missed the low end of the estimate range. Specifically, in November, sales were revised down by 22,000 to 697,000. New home sales in December were 694,000 which missed estimates for 728,000 and the lowest estimate which was 719,000. This was the weakest new home sales reading since July. That doesn’t jive with the spike in starts, but the housing market isn’t as hot as starts suggest. This is still a slow and steady housing market though. That’s supported by the quarterly average of new home sales. The quarterly average was 699,000 which is 1,000 above Q3 and is the cycle high.
New home sales in the South have crashed in the past few months, which doesn’t correlate with the region’s demographic dynamics. It is the biggest housing region. As you can see from the bottom left chart below, sales fell from 410,000 to 347,000 in December which is the lowest reading since October 2018. It was the largest percentage sequential decline since March 2015. In 3 months, sales have fallen 94,000. This decline probably won’t continue.
Sales in the West have been on an unsustainable ramp as they were up 57,000 to 241,000. That’s 99.2% yearly growth which is the highest growth rate since April 1983. Even for a volatile index, this was a big spike. The other 2 regions didn’t have as huge changes as sales were down 4,000 sequentially in the Northeast to 30,000; sales rose 7,000 in the Midwest to 76,000.
The recent decline in long rates will help housing. The 30 year yield is at 2.06% which is near the record low of 1.9% it made last year. The median single family new home sales price was $331,400 which is up 0.5% from last year. It is down 3.5% from the record high it made in November 2017. The median existing home price is $274,500 which is 3.8% below the record high it made in June 2019. At the current sales pace, the supply of homes rose to 5.7 months from 5.5 months. The recent low was 5.3 months in September and the recent high was 7.4 months in December 2018. The inventory balance has improved since the end of 2018, but it’s not as tight as existing home inventory which is at a record low.
Sanders Has Momentum Heading Into Early States
The first 4 Democratic presidential elections are in Iowa (caucus) on February 3rd, New Hampshire (primary) on February 11th, Nevada (caucus) February 22nd, and South Carolina (primary) on February 29th. It’s entirely possible that Sanders wins them all, except South Carolina which would give him momentum heading into the rest of the election. In the average of recent polls, Sanders is up by 3% in Iowa and 8% in New Hampshire which is very close to his home state of Vermont. There have only been 2 polls in 2019 in Nevada where Biden is up by 1% and 6%. There’s not much information there. There also haven’t been many polls of South Carolina, but the one poll this year has Biden up by 21 points. It’s expensive to run a poll. There won’t be many in elections deemed not close.
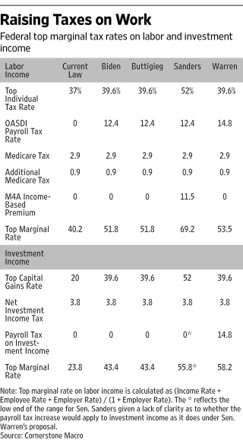
All these polls along with Biden’s slimming 5.3% lead in the national race equate to the PredictIt betting market showing Sanders with a 40% chance of being the nominee and Biden with a 37% chance. The table below gives you a glimpse of what this means for tax rates. In short, they will go up significantly especially for upper income people if Sanders is elected. They will increase modestly under Biden if he gets his way. Obviously, plans need to get through Congress, but it’s likely the Dems do well in the Congressional races if they win the presidency. Sanders’ rise in the polls is partially why the IHF health insurance ETF is down 4.15% in the past 3 trading sessions.
Yield Capping Could Be Coming?
The Fed is interested in ways to combat the next recession since the Fed funds rate is already in the low single digits and it doesn’t want to cut rates below 0%. The Fed has had a very long time to mull this over as this is the longest expansion since the 1800s and rates have been very low throughout it. It wouldn’t be ideal to raise rates just to be able to cut them because that could cause a recession. Plus, inflation doesn’t justify rate hikes. We’ve recently seen wage inflation moderate and commodities prices have fallen year to date.
One of the latest ideas being discussed isn’t new. It is yield caps on short to intermediate term securities. As you can see from the chart below, the Fed capped short rates from 1942 to 1947 and it capped long rates from 1942 to 1951. In November, Brainard stated the fixed time of these yield caps would end the policy automatically. She stated, “any securities that were acquired under the program would roll off organically, unwinding the policy smoothly and predictably.” The obvious problem is markets aren’t smooth and automatic policy doesn’t always work. When Powell stated the Fed’s balance sheet was on autopilot in 2018, markets became volatile.
Potential Manufacturing Recovery?
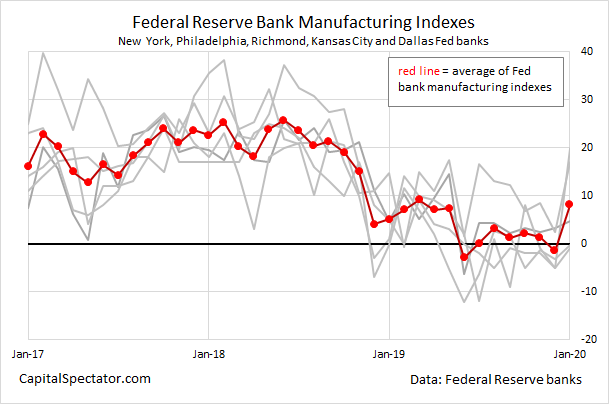
As we have discussed, the January Markit flash manufacturing PMI fell, in what was a good report (because of services). On the other hand, all 5 of the January regional Fed manufacturing reports improved. The chart below shows their improved average.
The main reasons for the increase were the big spikes in the Philly Fed & Richmond Fed indexes. For the most part, in this slowdown in 2019, regional Fed indexes have been more optimistic than the ISM manufacturing PMI. We will learn the truth on Monday when the ISM PMI comes out.
Conclusion
The intermediate term trend in new home sales is fine, but the December report disappointed. Bernie Sanders has momentum in the polls and might win 3 of the first 4 early state elections. That would send the IHF ETF lower and could send the whole market lower as he could raise taxes significantly. The Fed is considering yield capping. It might be tried in the next recession depending on where the Fed funds rate starts the recession at. All 5 of the regional Fed manufacturing indexes have increased, but the Markit flash PMI fell.
Have comments? Join the conversation on Twitter.
Disclaimer: The content on this site is for general informational and entertainment purposes only and should not be construed as financial advice. You agree that any decision you make will be based upon an independent investigation by a certified professional. Please read full disclaimer and privacy policy before reading any of our content.


