UPFINA's Mission: The pursuit of truth in finance and economics to form an unbiased view of current events in order to understand human action, its causes and effects. Read about us and our mission here.
Reading Time: 5 minutes
The stock market is about to be in the longest bull market since World War II if it makes new highs and stays there in the next few weeks, demonstrated in the chart below.
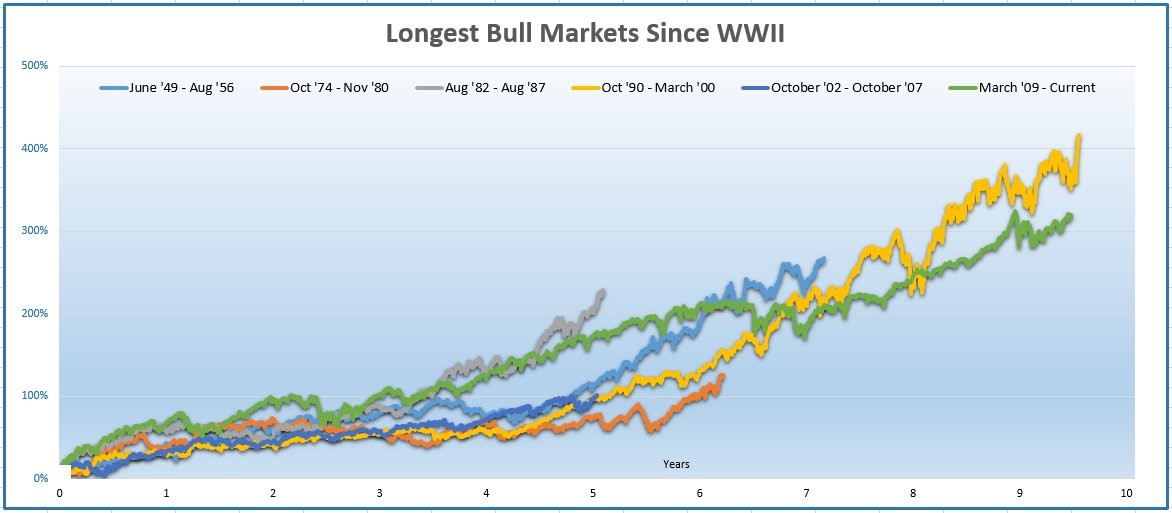
The total gains from this bull market have been much lower than the gains in the 1990s bull market which it is about to pass in length. This bull market has been following the mantra “slow and steady wins the race.” Because this bull run has lasted so long, there is a graveyard filled with poor projections and calls for a crash to come.
The calls for this cycle to end were the loudest in 2012 during the European sovereign debt crisis and during 2016 after the energy markets were roiled, the manufacturing sector pulled down the American economy, and emerging markets cratered. Ever since the cyclical recovery started in mid-2016 the only strong calls for this expansion to end have been based on the idea that bull markets die of old age. That has proven to be faulty analysis as there needs to be a catalyst for a recession and bear market to occur.
GDP Per Labor Participant
Real GDP per capita grew 2.2% per year from 1955 to 2007 and then only 1.6% since 2010. As of Q2 2018, the economy is still 16% below its previous trend line which is a big gap considering this is about to be the longest expansion in over 100 years. You can look at the gap in real GDP growth per capita in two ways. You can say it shows the economy never recovered and is therefore in a vegetative state where it fails to follow the previous trend. You can also say growth below the trend line means the economy still has room to expand. The streak of decades of growth following along the trendline would be broken if this cycle doesn’t expand at a quicker rate and avoid a recession.
Interestingly, it’s possible both those options are wrong because they follow along a false premise. GDP per capita is more of an ‘apples to apples’ comparison than just looking at GDP, but it doesn’t go far enough. Because America is getting older and fewer young people are working, the labor force participation rate has cratered. Therefore, it’s best to compare the average GDP growth on a per labor force participant basis.
As you can see from the St. Louis Fed chart below, the growth rate from 1955 to 2007 and the growth this cycle are both 1.7% per year.
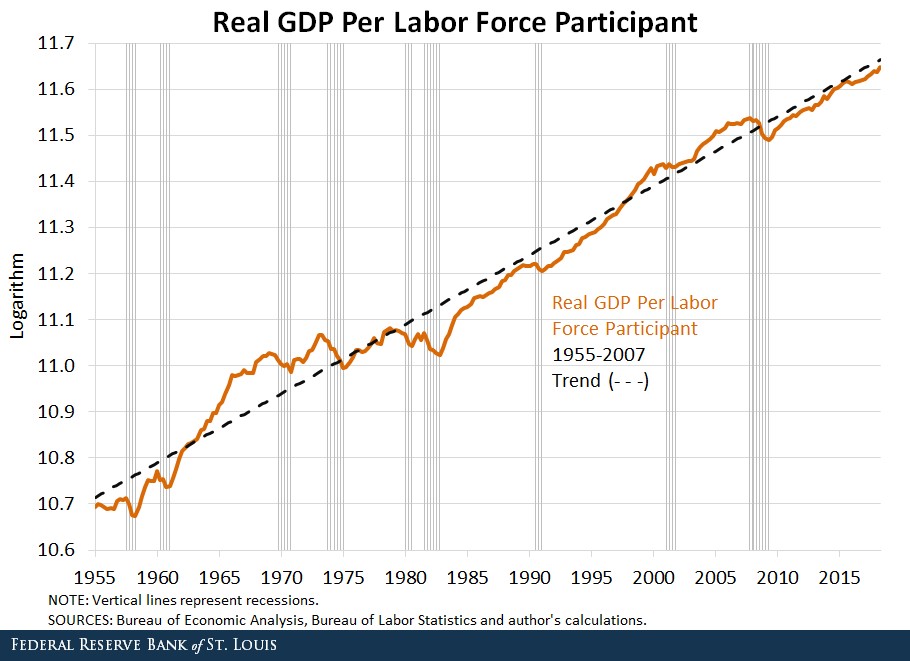
The growth rate is only slightly below the trend line. Before you get worried about a recession, the growth rate usually gets ahead of the trendline at the end of the cycle and then it falls below the trendline during the recession.
Strong JOLTS Report
The June Job Openings and Labor Turnover Survey was very strong which could be considered a bad thing because it means the labor market is nearly filled. The total job openings in June were 6.662 million which beat estimates for 6.65 million. The May report was revised higher from 6.639 million to 6.638 million. As you can see from the top chart below, this means there are more job openings than there are people looking for jobs. Historically, it’s rare for this ratio to stay this low for a long time. One aspect which somewhat counteracts this point is the number of hires was only 5.651 million which was down from 5.747 million in May; it is much lower than the number of job openings. With the slack in the labor market being consumed, there are less workers who are qualified to fill the jobs that are available, which explains why low income wage growth accelerates towards the end of the cycle.
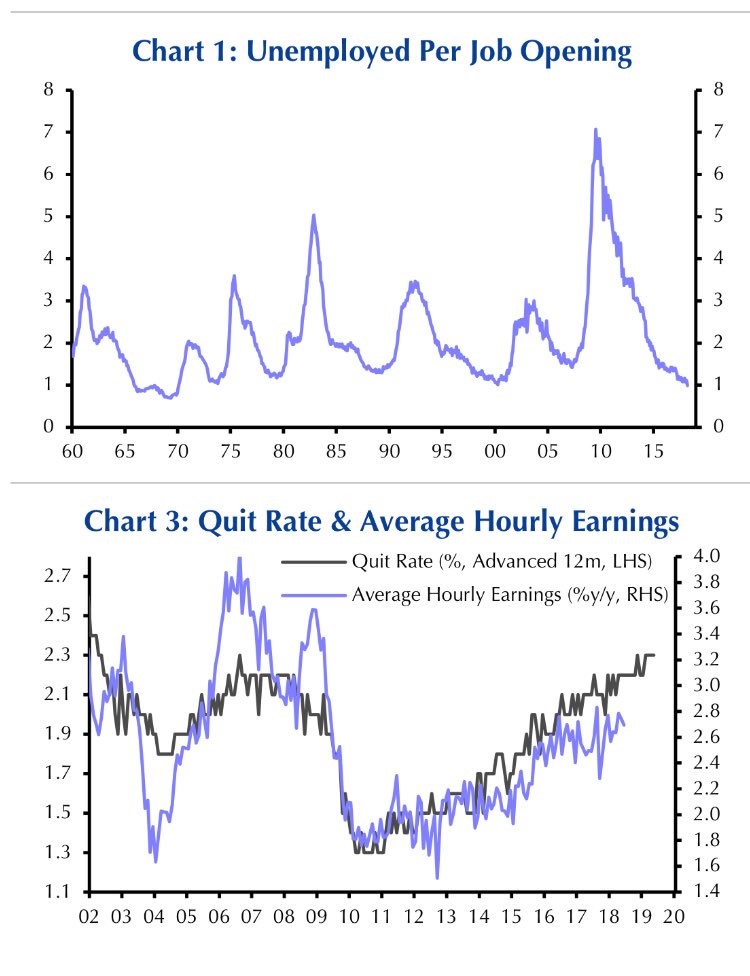
The bottom chart shows the quit rate compared to the average hourly earnings growth. The quit rate was flat at 2.3% in June. A high quit rate signals the economy is strong because it means workers are confident enough to leave their jobs because they know other jobs offer a better work experience which could mean better pay, better hours, or more upward mobility. In a healthy market people are switching jobs often. It’s similar to a market having a lot of trading volume which makes it healthier since there is liquidity. This chart has the quit rate leading the average hourly earnings growth, meaning the average hourly earnings growth rate could accelerate in the next 12 months as the labor market tightens.
No Risk Of A Recession
The table below shows the historical action in a few indicators prior to the past 7 recessions and the data for this cycle.
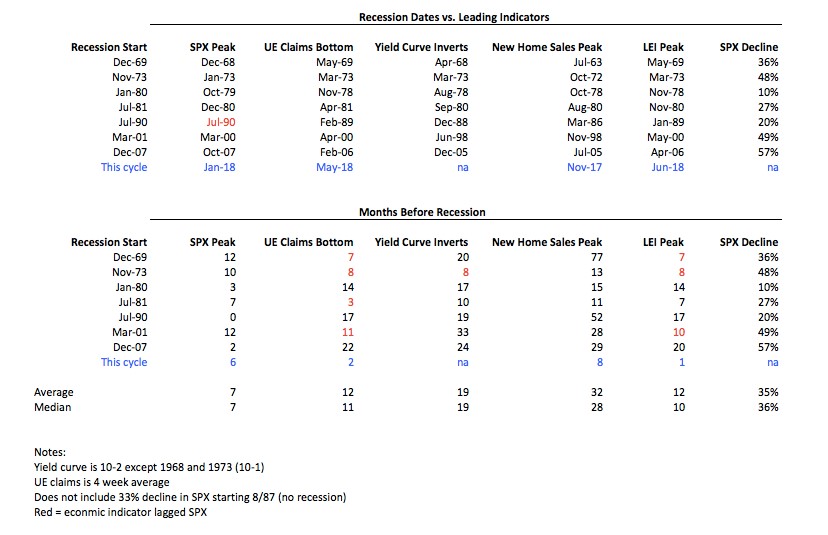
Only the S&P 500’s peak indicates a recession could be coming. The S&P 500 peaked 6 months ago; on average the market peaks 7 months before recessions. However, this entire indicator will be upended if the market rallies less than 1%, reaching a new record high. The unemployment claims, yield curve, new home sales, and leading indicators all don’t signal a recession is coming anytime soon.
Tariffs Being Discussed
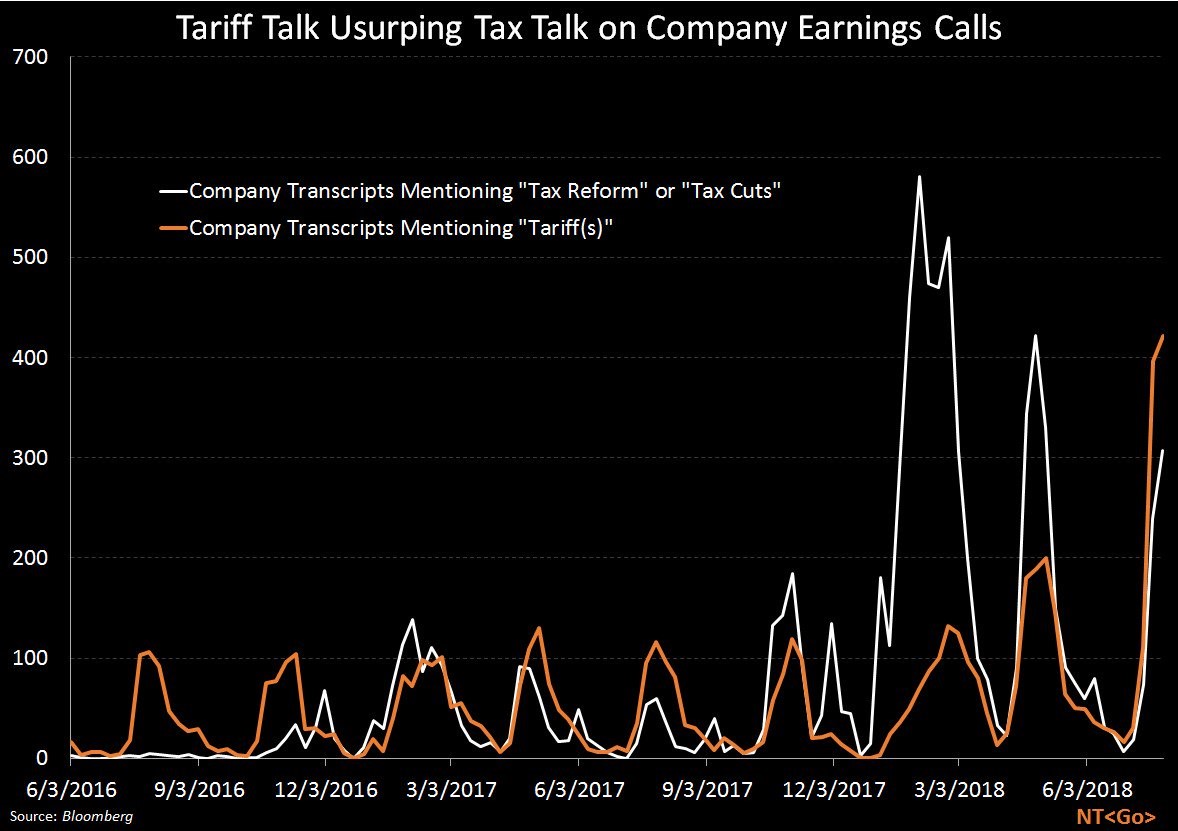
There isn’t much risk of tariffs causing a recession in the near term because they have been very small. A recession could be catalyzed only if the worst threats come to fruition. For example, the Chinese just issued a 25% tariff on $16 billion worth of goods (333 goods will be taxed). That is not large enough to make a significant impact. However, the risk is still alive as long as the threats keep being made. The Bloomberg chart below shows the tariffs have become more of a popular topic on conference calls than the tax cuts.
Conclusion
The economy and stock market are in a pretty good situation when the biggest worry is a 25% tariff on $16 billion worth of US goods sold to China. By the market rallying to near record heights, investors are making the implicit bet that either something will be negotiated or that the tariffs will stay low. Obviously, no country wants to get into a trade war. You can tell this by the fact that after months of threats and negotiations, there haven’t been any crippling tariffs implemented yet. The latest American tariffs on China will be put into place on August 23rd. That’s a 25% tariff on $16 billion of imports from China.
Have comments? Join the conversation on Twitter.
Disclaimer: The content on this site is for general informational and entertainment purposes only and should not be construed as financial advice. You agree that any decision you make will be based upon an independent investigation by a certified professional. Please read full disclaimer and privacy policy before reading any of our content.


