UPFINA's Mission: The pursuit of truth in finance and economics to form an unbiased view of current events in order to understand human action, its causes and effects. Read about us and our mission here.
Reading Time: 5 minutes
It’s easy to get dismayed by the headlines because the total job growth in July was 157,000, which missed estimates for 190,000 jobs created. Usually, these reports have details which conflict with the headlines. This one is no different as the fundamentals of the labor market remain strong. The best part of this report was the prior two months saw a net gain of 59,000 jobs after revisions. June now added 248,000 jobs instead of 213,000 and May added 268,000 instead of 244,000 jobs. That total gain from revisions more than makes up for the miss in the July headline number and shows how the July report can also be revised in the next two months.
Temporary Weakness
This report was dragged down by the government as it lost 13,000 jobs. The sharp decline in local government jobs may have been a seasonal issue because in July teachers lose their jobs for the summer. The sporting goods, hobby, book, and music stores lost 31,800 jobs mainly because of the Toy R Us bankruptcy. One good one time item was that auto manufacturers skipped their usual summer retooling which usually causes layoffs. With these reasons, it’s important to realize what is good is bad and what is bad is good. We want to see negative one time items because it means there is underlying strength.
Underemployment Rate Falls
The underlying numbers of this report were great because employment improved while wage growth didn’t accelerate too fast, which would cause the Fed to hike rates quicker. It was a Goldilocks report. The unemployment rate fell from 4% to 3.9% which met estimates. The underemployment rate fell from 7.8% to 7.5% as you can see in the FRED chart below.
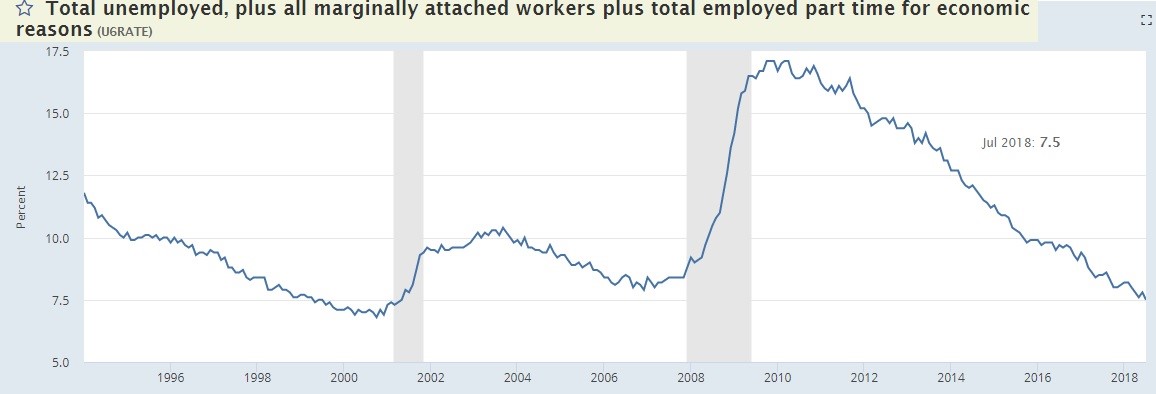
This is the lowest level since April 2001. The rate troughed at 6.8% in that cycle. When the rate was falling, it first hit 7.4% in May 1999. If this cycle follows the same trajectory, the rate will trough in 17 months which is December 2019.
Manufacturing Sector On Fire
There were 37,000 manufacturing jobs added. This sector of the economy has been on a significant rise since there aren’t enough workers to meet the intense demand for labor. It was above the revised growth of 33,000 jobs in June and well above the highest estimate which was 21,000 (the consensus was for 15,000 jobs created). Some are saying the manufacturing sector is on a new secular trajectory. You can see the improvement since 2009 in the chart below.
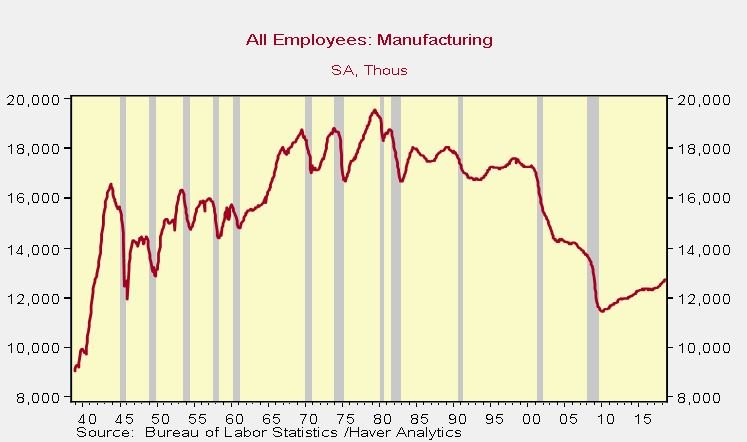
We aren’t ready to say this is the dawning of a new age, but this is a run few economists expected.
Prime Age Labor Participation Rate Improves
The labor participation rate was stable at 62.9% which was above estimates for a 0.1% drop. While the overall index was stable, there was improvement. The prime age labor force participation rate increased from 82.0% to 82.1%. It is just one tenth below the cycle peak of 82.2% in February 2018. We want to see improvement in this number, but not too quickly because then the labor market will be at full employment which would indicate that the expansion is almost over.
The ECRI chart below shows the employment to population rates for those with at least a high school diploma and those without a high school diploma.
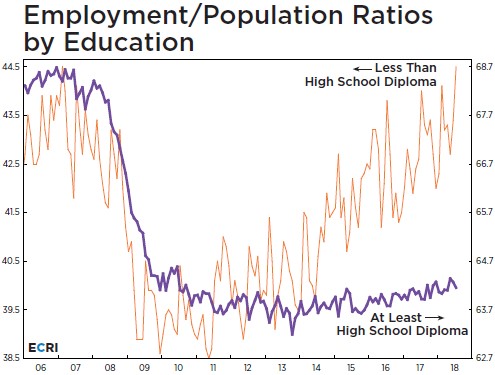
To be clear, the scales are different since education provides more job opportunities. The point this chart makes is the rate is improving for the least educated workers while it is barely up for those who have graduated high school. Sometimes charts make data look more impressive than it is. This chart is the reverse because the improvement in the least educated workers is dramatic. We previously discussed that low income wage growth is generally the best at the end of the business cycle.
The employment to population ratio for the least educated workers hit 44.5% which is the highest ever. That’s about a 6% improvement from the trough of the cycle. It is catching up to the rate for those who graduated high school which is 64.2%. To be clear, the percentage of workers who haven’t graduated high school has shrunken dramatically. Before the mid-1960s, over 50% of workers hadn’t graduated high school; now 10% of the population hasn’t graduated high school.
Wage Growth Signals Goldilocks
We want to see wage growth, but if it rises too quickly, this creates greater inflation in the overall economy which would force the Fed to raise rates in effect slowing the economy. This was a perfect report because year over year hourly wage growth was 2.7%, which is just right. It was up 0.3% month over month. The average work week was 34.5 hours which was down 0.1 from last month. The most important stat is weekly earnings because it combines hourly earnings and the length of the work week. Weekly wage growth was down from 3.34% in June to 2.99% in July. The June reading was one of the highest of this cycle thus still giving the Fed some room to stay on the current path of rate hikes, which means you should expect about 3 hikes by September 2019, according to consensus.
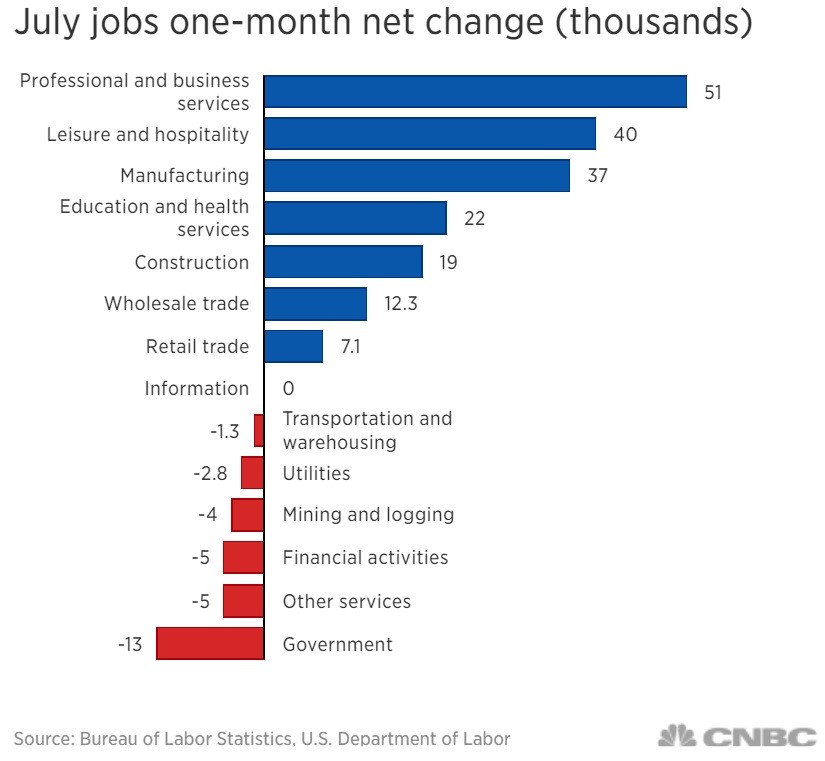
The chart below ranks each industry by pay. Utilities pay the highest wages and leisure and hospitality pay the lowest wages.
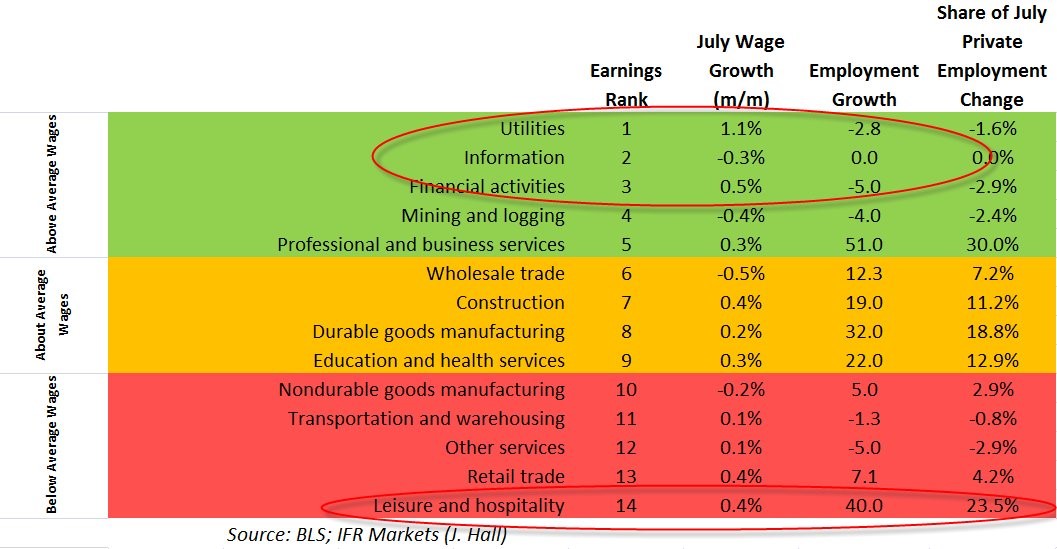
Utilities jobs received the highest month over month wage growth which was 1.1%. The worst industry was wholesale trade which saw a 0.5% decline in month over month wages. Professional and business services added the most jobs at 51,000, being responsible for 30% of the job gains. Financial activities and other services both saw the largest private sector declines at -5,000.
Conclusion
This labor report was great for the stock market because there’s no reason to fear economic weakness nor is there reason to fear inflation. That’s an example of a Goldilocks report. The May and June reports added an average of 258,000 jobs; the labor market would have become much closer to being full if that level of job growth continued. Underlying numbers such as the U6 underemployment rate suggest the labor market is nearly full. The labor participation rate for prime age workers suggests there could be over 2 more years of job growth left before the labor market is full.
Have comments? Join the conversation on Twitter.
Disclaimer: The content on this site is for general informational and entertainment purposes only and should not be construed as financial advice. You agree that any decision you make will be based upon an independent investigation by a certified professional. Please read full disclaimer and privacy policy before reading any of our content.


