UPFINA's Mission: The pursuit of truth in finance and economics to form an unbiased view of current events in order to understand human action, its causes and effects. Read about us and our mission here.
Reading Time: 5 minutes
The U.S. economy continues to show signs that the Q2 GDP growth rate might be above 4% which would be one of the best quarters of this expansion. If this rate were to continue, what some consider impossible would be happening. The bears say this is just a late cycle boost in growth which is unsustainable. While that might be true, it’s still impressive. With this expansion being the 2nd longest since 1854, investors and economists have been calling this economy late cycle for about half the length of a normal cycle. The jeers for a recession were particularly high in 2016 as the expansion hit the vaunted 7 year mark. Bears claimed buying stocks in 2016 was picking up pennies in front of an oncoming train. It turns out those pennies were silver dollars and there were a bunch of them on the train tracks.
The economy being late cycle doesn’t take anything away from profits made in stocks in 2017 and 2018. Some might say it is more difficult to make money in risk assets at the end of a business cycle, but that’s an idealistic perspective. It’s always difficult to stay bullish as some investors call for a double dip recession in the beginning of expansions and economists claim mid-cycle slowdowns which often rears their ugly head is a sign the economy is going into a recession. These points all show that there’s nothing wrong with good news and profits late in the cycle. Late cycle doesn’t equal sell until the data starts to turn negative.
Great Retail Sales
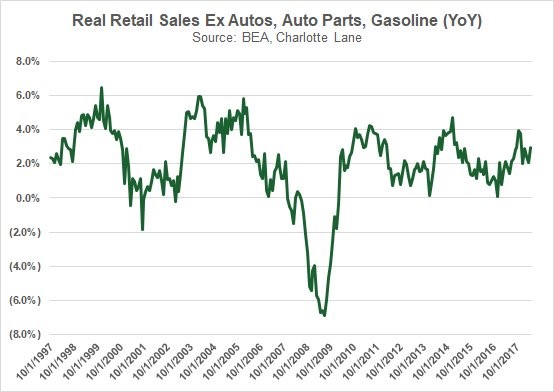
Besides the economy being late cycle, generating inflation, and seeing the Fed hike rates which is causing the yield curve to flatten, the other criticism of this great economic data is that oil price increases are boosting industrial production through utility and mining growth and retail sales through higher gasoline sales. This is correct as the year over year retail sales in May were up 5.9% with a big help from gasoline. Gasoline stations are 9% of retail sales. They drove 23% of the value growth in retail sales in May as sales were up 17% year over year. As you can see from Charlotte Lane’s chart below, the real retail sales were up 2.9% excluding autos, auto parts, and gasoline. Some say the comparison was easy, but nominal May headline retail sales were up 4%, so that’s a bit of a stretch.

Source: Charlotte Lane
Economic data analysis needs to include a deep dive because the headlines often mislead you about how good the results were. Headline results are sometimes not as good as they seem, and poor headlines are sometimes better when you review the details. Let’s review the month over month results briefly to show that while there are caveats, this was still a good report. Headline retail sales were up 0.8% which doubled estimates. The control group also beat as it came in at 0.5% instead of 0.4%, showing that it wasn’t all autos and gas that helped sales. May was a good month for brick and mortar stores as restaurant sales were up 1.3%, department store sales were up 1.5%, and clothing store sales were up 1.3%. There was across the board strength except in the usually strong online stores as they only had 0.1% growth.
The Models Are Ramping
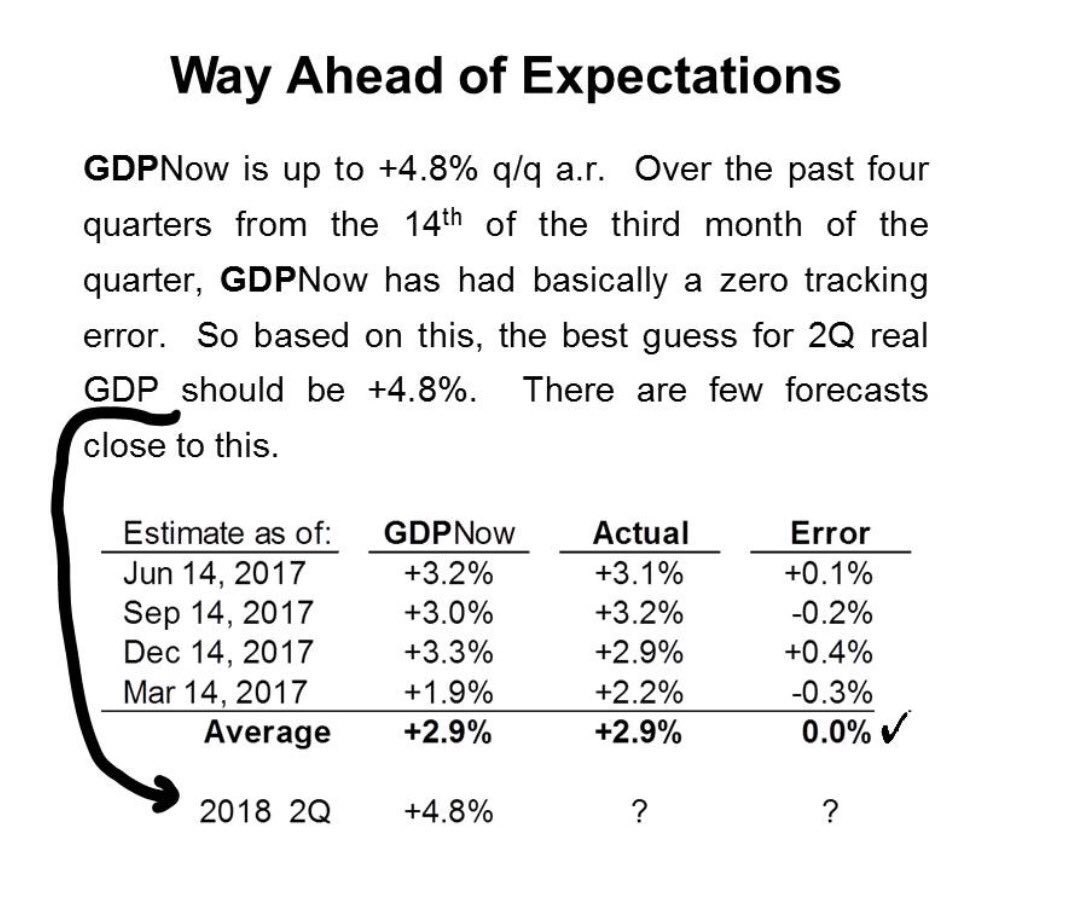
The GDP models don’t care about the fact that the oil prices increasing could make this strength unsustainable. Once the data is put in, results come out. There’s an advantage in knowing that these are objective formulas which simply return guesses for GDP growth. The great data is causing these models to ramp higher to the levels dreamed about after the tax cut was passed. The CNBC GDP tracker has an average reading of 3.8% out of 10 estimates. The Atlanta Fed Nowcast is the most bullish as it expects an astounding 4.8% GDP growth rate. The Atlanta Fed model has been lampooned by the bears as it has wide variations which have recently involved the Nowcast starting out very high, only to move much lower. The bears love to point out how Q1 growth was expected to be 5.4% in early February and the initial report was 2.3%.
Our goal here isn’t to knock down the bears; it’s to review the data objectively and show when the bulls and the bears are correct and incorrect. We’ve been supportive of the Atlanta Fed model after the quarter is mostly through because it’s accurate, not because it’s bullish. The table below is quite remarkable as it shows there has been an average of no tracking error from the 14th of the 3rd month of the quarter, which in Q2 is June 14th. Lampooning an amazing estimate to support your own biases is foolish.

Source: Twitter @victoriouscake
2020 Recession Consensus?
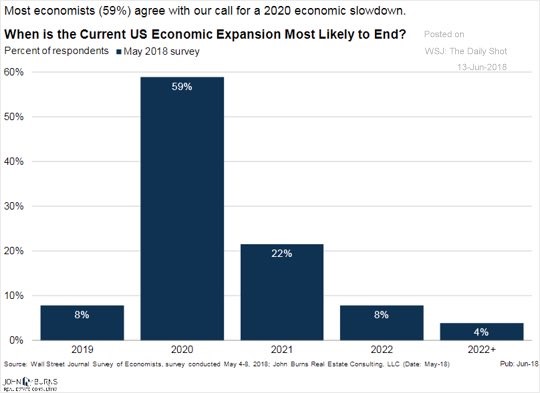
Stocks do well when the yield curve is flattening, but that doesn’t mean you should ignore the warning sign when the curve inverts. The 10 year treasury minus the 2 year treasury is just 37 basis points. However long it takes for the curve to steepen after it inverts is the time it takes to get to the next recession. The WSJ chart below implies the consensus is the curve will invert in the next 6 months and stay that way for about a year before it steepens as the most popular answer for when the next recession will be is 2020.

Source: Wall Street Journal
In a previous article, we showed no analysts surveyed by Bloomberg expect negative growth in 2020. The models spit out growth estimates based on the economic data. The analysts use their experience to formulate opinions on the economy. It’s difficult to model recessions.
Conclusion
The U.S. economy is in one of its strongest quarters of this expansion, but it’s running out of time if the yield curve is any guide as there might be an inversion by the end of the year, signaling a 2020 recession. Hopefully, this article helped you understand how models work compared to forecasts. Investors are actually investing based on forecasts for the second half of 2018 and 2019 estimates. They are looking at the future, not the present quarter. However, 2020 is too far in advance for tactical moves as many investors try to squeeze the last juice out of this bull market. If investors were making moves based on 2020 growth expectations, stocks wouldn’t be near their record highs.
Have comments? Join the conversation on Twitter.
Disclaimer: The content on this site is for general informational and entertainment purposes only and should not be construed as financial advice. You agree that any decision you make will be based upon an independent investigation by a certified professional. Please read full disclaimer and privacy policy before reading any of our content.


