UPFINA's Mission: The pursuit of truth in finance and economics to form an unbiased view of current events in order to understand human action, its causes and effects. Read about us and our mission here.
Reading Time: 5 minutes
Previously, we’ve mentioned that inflation is important to study when the economy is late in the cycle because the Fed starts to take away the punch bowl. When the Fed raises rates, lending tightens, and the economy starts to falter. Following the logic of that point, clearly the Fed policy meetings are important to investors.
Some bearish traders claimed the end of QE, the balance sheet unwind, and rate hikes would each cause a crisis. Those never occurred causing the natural reaction to brush off any worries about rate hikes. You should be weary of that bias now as the hike cycle is close to ending. There’s never an absolute point you can make about economics or stocks, but there’s a high likelihood that the start of rate hikes isn’t going to be problematic because the Fed is simply going from accommodative to slightly less stimulative. It took until December 2015 for the first rate hike of this cycle which was quite a long time.
The truth is rate hikes are the most problematic for the bull market when the hikes push the Fed from being accommodative to restrictive. When policy is restrictive, it’s only a matter of time until the economy starts to slow. The slowdown turns into a recession as the Fed only starts cutting rates after the economy starts to falter. The rate cuts in the summer of 2007 did nothing to prevent the recession which started in December.
Fed Raises Rates And Alters Guidance
There’s no way to be sure when the Fed is hitting a contractionary policy, but real rates and the yield curve can be a guide. We will review the yield curve later in this article. The current target rate was raised by 25 basis points to a range of 1.75%-2%, while the core CPI is 2.2%. Therefore, real rates are still negative. Two more rate hikes would give us positive real rates assuming inflation goes up less than 0.2%.
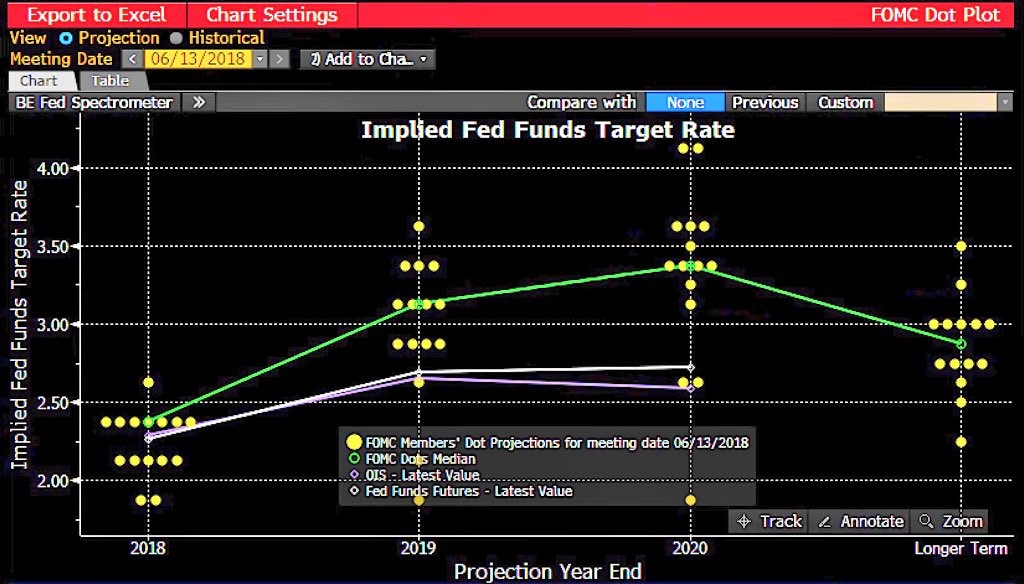
Source: Bloomberg
The 25 basis point rate hike was expected; the real news was the guidance change. The Bloomberg table above shows the latest dot plot and the median projections for future rates. The guidance for rate hikes in 2018 was increased from 3 in total to 4 in total. The estimate for 3 rate hikes in 2019 was constant, but the ending rate was increased because of the extra 2018 hike. The 2020 and long run guidance for rate hikes was left unchanged. Since the long run rate is expected to be 2.9%, the Fed will be above that rate by the last hike in 2019 and continue to be above it in 2020 as there is guidance for one more hike that year. With the inclusion of a 2020 hike and a rising long run rate in past meetings, it feels like the Fed is hiking rates as much as it can get away with, meaning it is hiking them until the stock market falls or the economy falters.
The most pivotal point to realize is the FOMC went from a 6-6 tie in terms of 3 or 4 rate hikes in 2018 to a 7-5 vote in favor of 4 hikes. There wasn’t a massive change in Fed policy. It just so happens that the one Fed official whose vote changed and caused an additional rate hike to be added in 2018. A hawkish movement just because Q2 GDP growth looks strong would be a mistake because the Fed can’t ignore the 2.2% growth in Q1 or the possibility that growth will decelerate in the rest of the year. The chance of 4 hikes in 2018 went from 45.3% to 52.4%. That muted response in the futures market shows how this wasn’t a big change. The Fed could change its mind if stocks or the economy falter.
Even though the Fed can change its mind, this is considered a hawkish hike because the Fed increased its guidance for 2018. That’s an unusual situation for this cycle because the Fed has tip toed around hikes by giving dovish guidance after most hikes. That was a trick to keep the stock market happy even as the Fed was hiking rates. The fact that the Fed isn’t tip toeing around rate hikes could be an indicator in of itself that the Fed has contractionary policy. The chart below from Pension Partners shows the Fed’s new dot plot is much more hawkish than the Fed funds futures. The market is starting to expect a recession in 2020, so it doesn’t think there will be any hikes then.
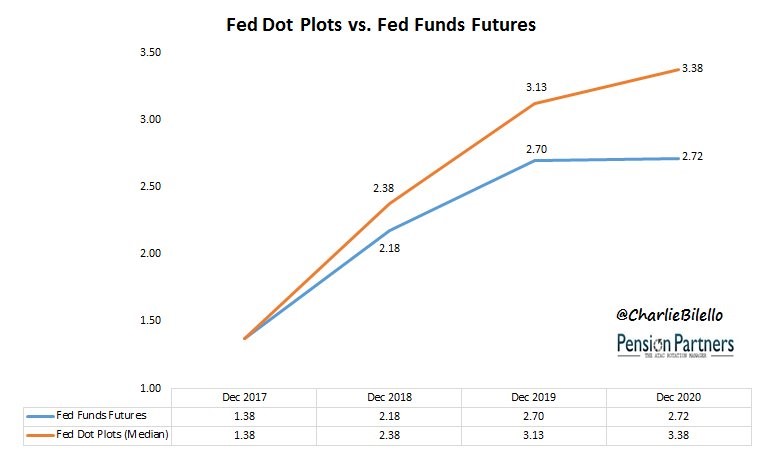
Source: Pension Partners
Other Guidance Changes
The FOMC table below shows the guidance changes from the March Fed meeting.
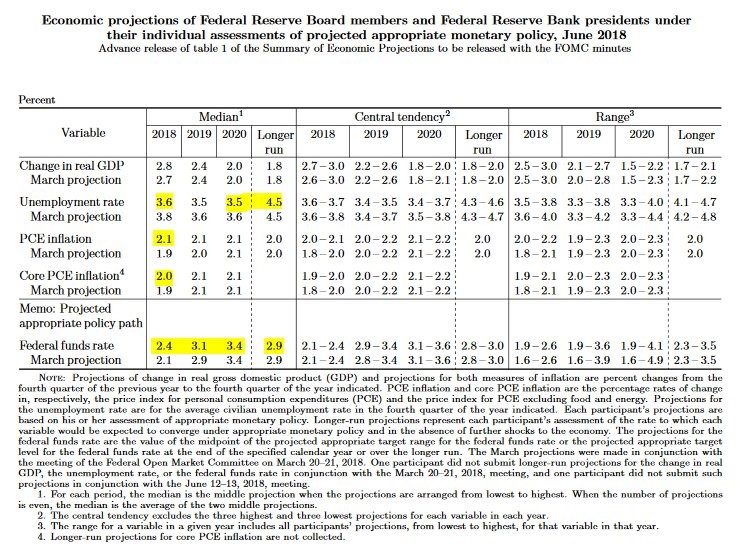
Source: FOMC
The GDP growth estimate went up from 2.7% to 2.8% in 2018. The unemployment rate estimate for 2018 fell from 3.8% to 3.6%. Inflation guidance rose as the estimate for PCE increased from 1.9% to 2.1% and the core PCE estimate went from 1.9% to 2%. Theses are all changes which cause the Fed to raise rates more. The Fed’s estimate for this year’s unemployment rate has been wrong in the past and has now come closer to reality as the current rate is 3.8%. The expectation was 4.1% at the December 2017 Fed meeting. At the December 2015 meeting, the Fed expected it would be 4.7%. The Fed has been too pessimistic on unemployment in the past few years. The scary part is the Fed expects the unemployment rate to be 3.5% in 2020 which assumes no recession. This projection has the potential to be even more wrong than the one in 2015 for 2018.
Yield Curve Is Flirting With An Inversion
When asked about the possibility of a yield curve inversion, Powell claimed this question is really about what good policy is. Specifically, he stated “I think that discussion is really about what is appropriate policy and how do we think about policy as we approach the neutral rate, how do we understand what the neutral rate is, how do we know where it is and what are the consequences of being above or below it.”
Obviously, the Fed thinks it is pursuing good policy or else it wouldn’t be doing it. However, the bond market disagrees. As you can see from the StockCharts chart below, the 10 year yield minus the 2 year yield is only at 39 basis points which means an inversion could occur by the end of the year and likely will by the beginning of next year. That effectively means the Fed is pushing the economy closer to a recession even though the core PCE inflation target of 2% hasn’t been met.
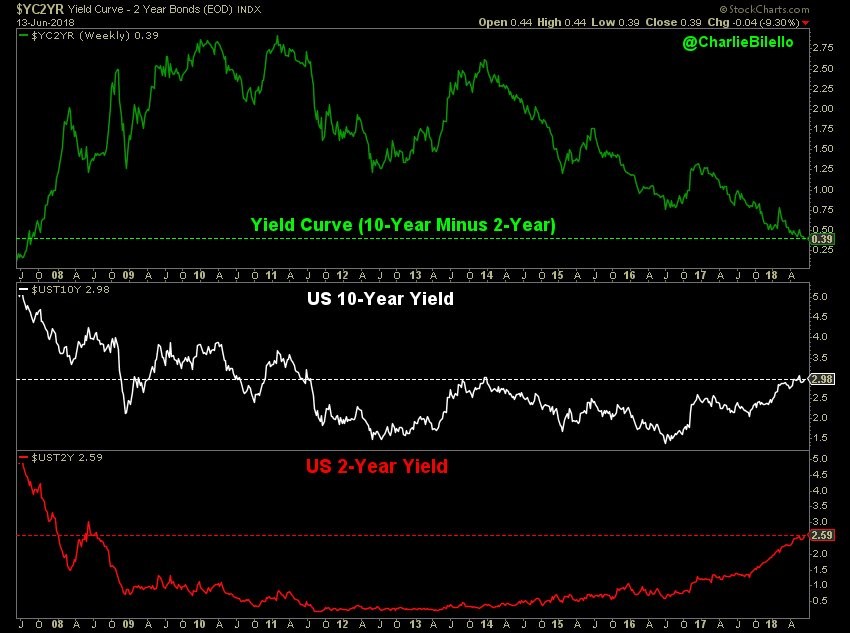
Source: StockCharts
Conclusion
The Fed has decided to hike rates quicker in 2018. The yield curve indicates that the Fed might not even be able to get those 2 hikes in without having the curve invert. Inversions have been great forecasters of future recessions, so you should consider planning your portfolio for a bear market. That doesn’t mean you should sell everything and hide under a rock. It means you should take a disciplined look at the risks you have on the table.
Have comments? Join the conversation on Twitter.
Disclaimer: The content on this site is for general informational and entertainment purposes only and should not be construed as financial advice. You agree that any decision you make will be based upon an independent investigation by a certified professional. Please read full disclaimer and privacy policy before reading any of our content.


