UPFINA's Mission: The pursuit of truth in finance and economics to form an unbiased view of current events in order to understand human action, its causes and effects. Read about us and our mission here.
Reading Time: 4 minutes
Some might be wondering how the ISM manufacturing index’s contraction in August only led to a 0.69% decline in the S&P 500 on Tuesday. That’s because expectations matter. The PMI missed estimates, but investors already saw the July industrial production report showing a decline in manufacturing and the Markit flash PMI below 50. Based on the regional Fed reports, the PMI could have been higher, but not enough to reverse the downtrend. In short, investors were braced for this weakness; they didn’t ignore it.
Manufacturing Is Contracting
Specifically, the chart below shows the PMI fell from 51.2 to 49.1. That’s the index’s 5th consecutive decline. It missed estimates for 51.3 and the low end of the consensus range which was 50.5.
The chart is great because it shows that while the manufacturing economy is contracting, it still is above 42.9 which is the breakeven line for overall growth. This explains why the index is consistent with 1.8% GDP growth which is very close to the actual consensus of 2%. Coming in just below the consensus sounds fine, but this PMI has consistently projected higher than actual GDP growth. The recently optimistic reading has gone mildly pessimistic.
Details Of The August PMI
There isn’t anything to like in this report. This was the first PMI contraction since August 2016 and the lowest PMI since January 2016. The new orders index fell 3.6 points to 47.2 which is the worst reading since 2009. Recently, the new orders index has been below inventories which is a terrible signal. It means discounting will need to occur. The August report was nothing different as the inventories index was up 0.4 to 49.9. That means new orders are falling significantly and inventories are about flat.
The ratio of new orders to inventories, seen in the chart below, suggests this manufacturing recession is broad. It might be broad and shallow.
The 2016 slowdown was deeper and narrower because it was driven by the weakness related to the massive crash in oil prices. Oil prices have been stable this year. Instead, the weakness is related to the trade war and the global slowdown. Just under 60% of U.S. manufacturing industries are showing year over year declines in production. In the last slowdown, that percentage reached the low 60s. It should surpass that peak in the next few months.
The chart below is a great indication of how the trade war is hurting the manufacturing sector.
The new export orders index has fallen off a cliff. It fell 4.8 points to 43.3 in August. That’s the lowest reading since the financial crisis. To be clear, sentiment is weaker than actual production growth. The trade war has damaged sentiment. The yearly decline in industrial production growth isn’t near where it was in 2015 and 2016. Yearly growth was 0.4% in July and it troughed at -4.3% in December 2015. Manufacturing production growth is -0.5% and it troughed at -2% in the prior mini-cycle.
Plan For The Unexpected
As we mentioned in a previous article, uncertainty isn’t ideal for running a business. Firms don’t like to expand when the macro and policy outlook is uncertain. There never is perfect certainty, but relatively speaking, now is an uncertain time which is making many businesses hold off on big risky projects. In the ISM report, 4 of the 10 firms quoted mentioned tariffs or the trade war.
A miscellaneous manufacturing firm stated, “Generally, business remains steady. However, we continue to plan for a hard Brexit and a long trade war between the U.S. and China.” It’s tough for firms to plan for a hard Brexit and a long trade war, but they have no choice. Traders are ready for a trade deal as soon a Trump hits send on a tweet, but firms are slower to react. They remain cautious about a deal coming soon.
Weak Markit PMI Too
The Markit manufacturing PMI was pretty much in line with the ISM PMI. The August reading of 50.3 was 0.4 above the flash reading, but 0.1 below the July reading making it the lowest PMI of the cycle. As you can see from the chart below, the index managed to avoid the first PMI below 50 in this expansion.
However, the report is still consistent with annualized manufacturing output growth of -3%. New export orders fell at the fastest rate in 10 years. The output expectations index hit its lowest reading ever. Firms are blaming the weakness on the global slowdown and the weakness in the automotive industry. The production index increased slightly, but it was still among the worst in the past 3 years and only increased because backlogs were being worked off.
A Narrative Killer
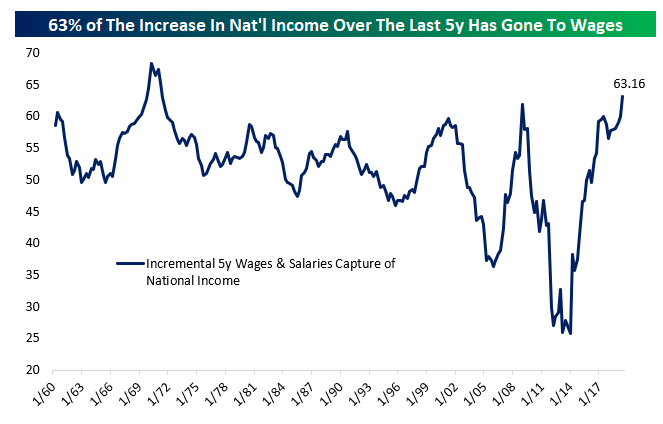
The chart below kills the narrative that workers aren’t receiving any of the benefits the economy is generating.
It shows 63.16% of national income in the past 5 years has gone to wages which is a historically high percentage. This increase might be related to the hikes in state minimum wages. To be clear, the national income is the total value of a country’s output in the year. It includes all new goods and services.
Workers are getting a decent slice of the pie. Real income growth has been positive recently and low-income workers have seen the fastest wage growth. This chart doesn’t claim there isn’t a high amount of income inequality. This chart helps to explain why consumer spending growth has been so strong recently despite the slowing economy.
Conclusion
This is about to be the second manufacturing recession of this expansion. The difference is this one is broader and shallower. We’re confident in saying mining output won’t fall at the rate of the last manufacturing recession because at the trough in 2016 it actually fell more than during the financial crisis. The fracking industry cratered from 2014 to 2016, but the industry wasn’t large enough to cause a recession. The narrative that workers aren’t seeing the economy’s gains was countered by the chart above. There is still inequality though. There have been huge gains in financial assets in this cycle. That’s a problem for those who don’t own any. About 50% of Americans don’t own stocks.
Have comments? Join the conversation on Twitter.
Disclaimer: The content on this site is for general informational and entertainment purposes only and should not be construed as financial advice. You agree that any decision you make will be based upon an independent investigation by a certified professional. Please read full disclaimer and privacy policy before reading any of our content.


