UPFINA's Mission: The pursuit of truth in finance and economics to form an unbiased view of current events in order to understand human action, its causes and effects. Read about us and our mission here.
Reading Time: 6 minutes
Near the end of the business cycle the most important factor to consider is whether inflation is getting out of control. The Fed’s goal is to have 2% year over year core PCE. The Fed likes to raise rates ahead of the goal being reached because once inflation accelerates, it’s not an easy force to stop. Raising rates only after inflation hits 2% would be a huge policy mistake. However, raising rates excessively before inflation accelerates could slow the economy into a recession. The great news about inflation is that the Fed knows it can fight it through hawkish monetary policy. The out of hand inflation in the 1970s and early 1980s was partially caused by the fact that the Fed thought it couldn’t fight inflation. That’s like a firefighter not realizing he can put out a house fire with a hose.
The Fed’s goal is to focus on limiting inflation while allowing for economic growth to flourish. Out of control elevated inflation causes the Fed to get especially hawkish, ending all hope of a continued expansion. With the Fed nearing hawkish policy in mid-2018, some believe the Fed has gone too far with rate hikes. This has been the lowest decade of inflation since the 1930s, with annual inflation averaging 1.7%, but the Fed has been getting more aggressive as it has hiked rates 5 times in the past 18 months because it fears inflation won’t be able to be stopped if it accelerates. Plus, it doesn’t like the idea of facing a recession with the Fed funds rate near the zero bound. The higher the Fed funds rate going into a recession, the more tools the Fed has at its disposal to shorten the down cycle.
The May CPI Report
This sets the table for why the May CPI report is very important. The ultimate judge of inflation is the core PCE in the eyes of the Fed, but as you can see in the chart made by @takis2910 on Twitter, core CPI and core PCE are highly correlated.
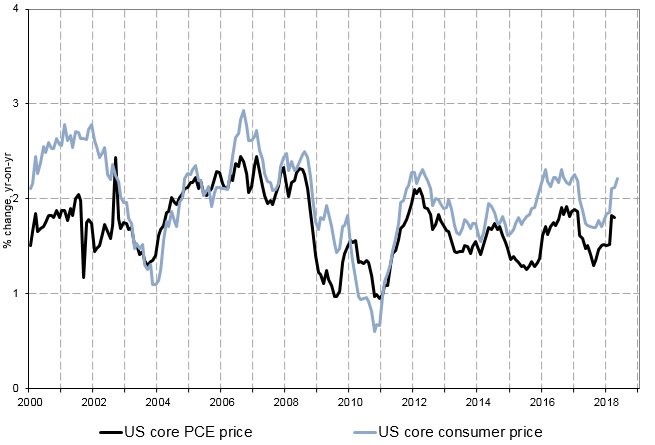
Source: Twitter @takis2910
The latest CPI reading gives us a good idea of how the PCE report will look on June 29th. All the headline data met estimates as the month over month CPI was up 0.2% and the month over month core CPI was up 0.2%. The year over year CPI was up 2.8% and the year over year core CPI was up 2.2%. There was a slight uplift in the data as year over year CPI was up 2.5% last month and core CPI was up 2.1% last month.
The chart gives a great depiction of the trend we’ve seen in this expansion. Most of the year over year inflation peaks came on easy comparisons and the troughs came on tough comparisons. If inflation declines at the end of the year, the Fed will look silly for raising rates so quickly. The current year over year comparisons are important. For core CPI, the comparisons will be easy up until November and for core PCE, the comparisons start getting harder in September. Just based on the year over year comparisons being very easy in the next few months, the core PCE should expand.
Details Of The CPI Report
69% of the headline year over year CPI of 2.8% was driven by rising energy prices which is why the Fed doesn’t focus on CPI alone. Clearly, everyone pays the cost of higher energy prices, but making policy based off what OPEC does at its June 20th-21st meeting doesn’t make much sense. You can’t have a clear predictable monetary policy if it follows a very volatile commodity with politically based decisions. Gasoline prices were up 1.7% month over month, but much of the other data points showed modest increases.
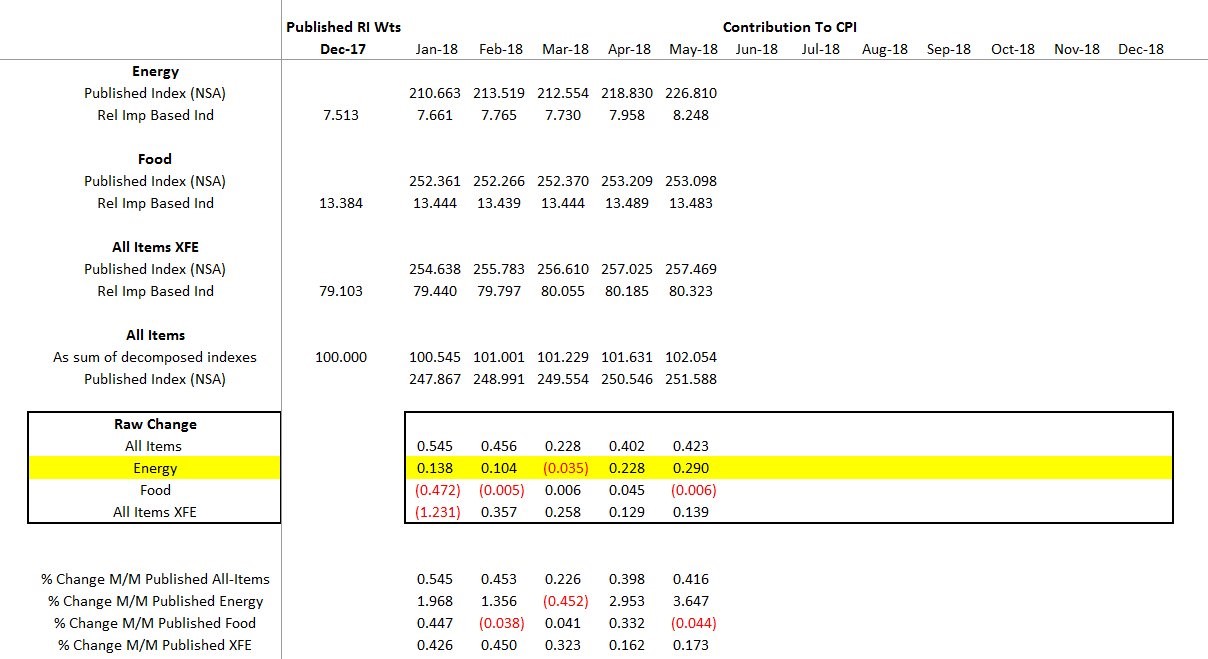
Source: Twitter @Techs_Global
Rent and owner’s equivalent rent were up 0.3% which means the housing component of core PCE will show a small increase in the May report. Medical costs outside of commodities and healthcare services were flat. New vehicle prices were up 0.3% and car insurance was up 0.4%. However, airfare was down 1.9%, apparel was flat, and used car prices were down 0.9%. There are hedonic adjustments in place which means that when the product is improved, the price increase is discounted.
Is Inflation Out Of Control?
Inflation is far from being out of control. The chart below from @Techs_Global is an alternative viewpoint of inflation that proves this point.
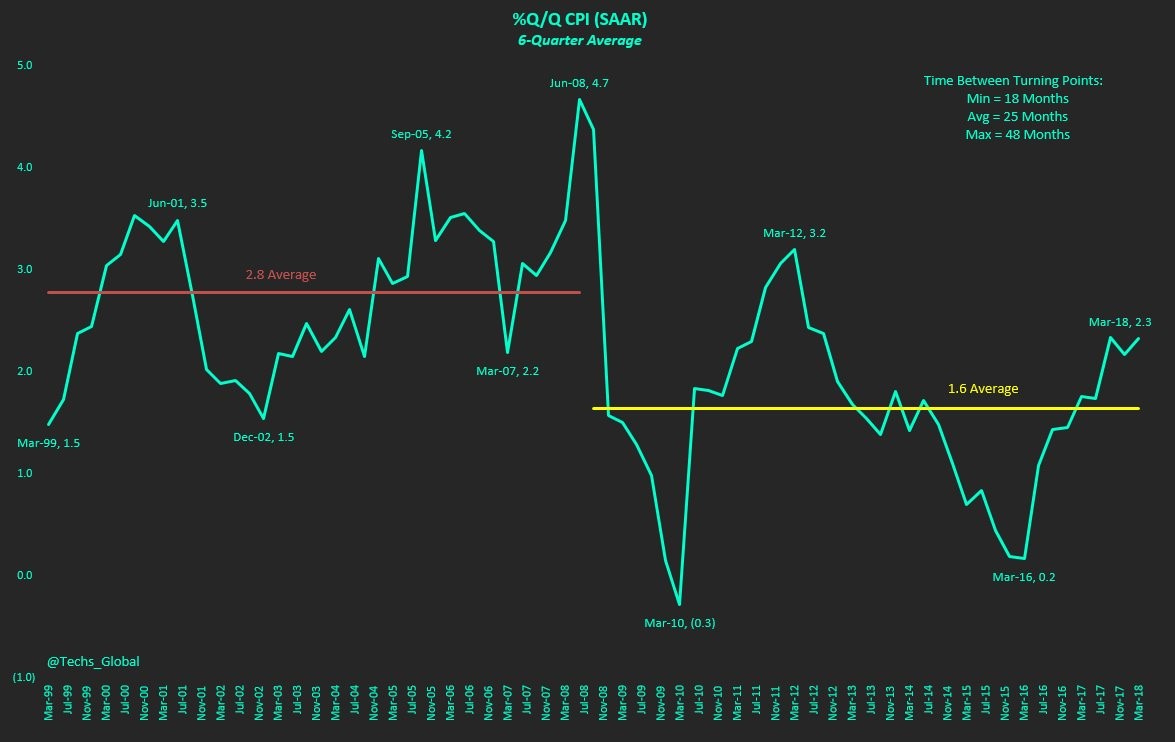
Source: Twitter @Techs_Global
The gold standard measurement will always be year over year core data, but other metrics can be interesting to review. The 6 quarter average of the quarter over quarter seasonally adjusted annual CPI shows the economy is in a lower inflation regime. It’s interesting to see the Fed maintaining a 2% target since it first officially announced the target in 2012 as official policy because the long term target inflation, as measured by core PCE, has moderated significantly since.
Why Is The Fed Raising Rates?
The economy is expected to grow 3.7% in Q2 based on the CNBC GDP tracker, which measures the average of 10 estimates, as of June 12th. This is after a weak Q1. Just one quarter of rapid economic growth isn’t enough to raise rates much especially with year over year inflation up on weak comparisons. We’ve painted a picture of why the Fed should slow down with rate hikes, but there are obviously some data points which disagree, which we will review below.
The @Techs_Global chart below shows the Manufacturing ISM leading the core CPI by 24 months with a high correlation.

Source: Twitter @Techs_Global
If the correlation holds, the core CPI will reach 2.5% in the next 1-2 years. That would likely push the core PCE above the Fed’s goal of 2%. The ISM and regional Fed reports show prices are overheating at a much more rapid pace than the CPI and PCE reports indicate.
The chart from Topdown Charts shows the historical z-score of the unemployment rate, consumer confidence, and small business survey since 1985.
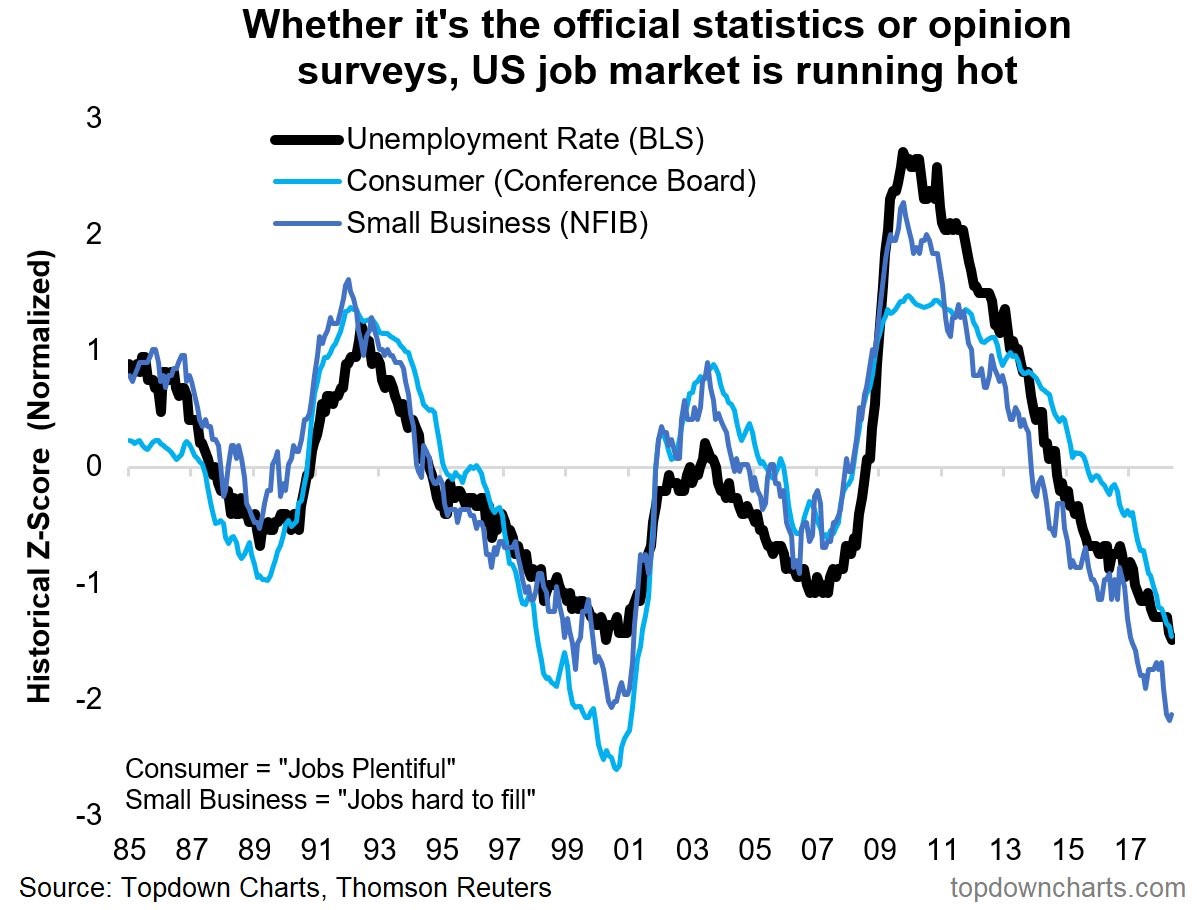
Source: Topdown Charts
In the survey the small businesses are asked if jobs are hard to fill and consumers are asked if jobs are plentiful. The three indexes have a very low z-score implying the labor market is overheating. We have reviewed other labor market reports which differ, but these data points support a hawkish Fed.
Small businesses are very confident because of the improving economy, lower tax rates, and regulation cuts. The May NFIB survey saw the confidence index reach 107.8 which was up from 104.8 in the prior month. This was the 2nd highest report in the 45 year history of this survey. Small businesses have signaled they need to hike wages to acquire workers. The NFIB chart below shows the planned hiring and actual hiring are near cycle highs. These show inflation is coming and growth is strong which supports a hawkish Fed.
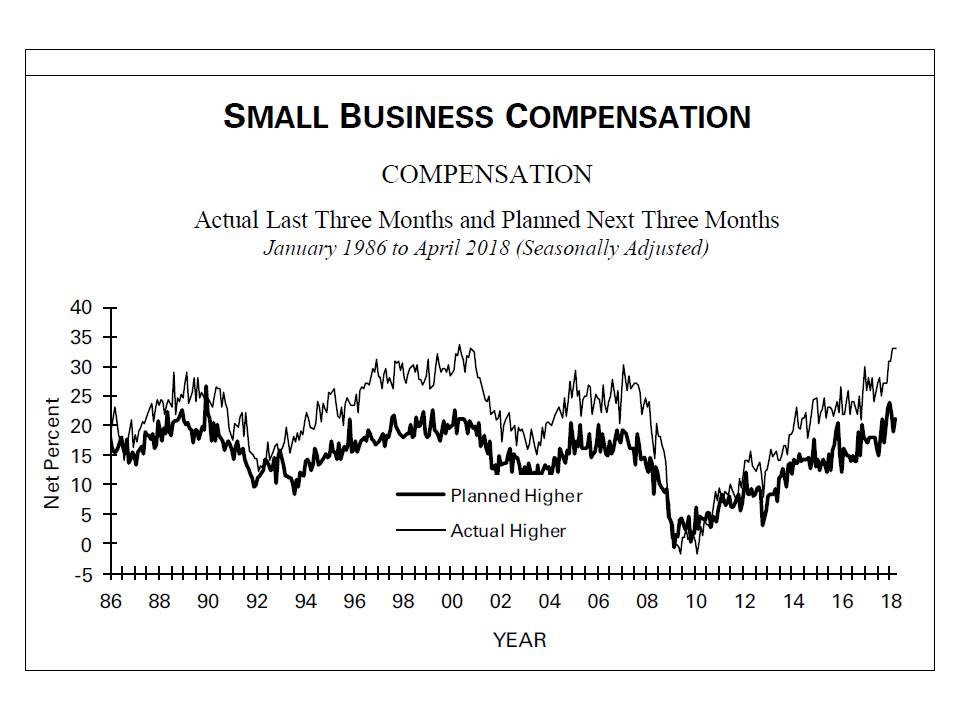
Source: NFIB
Conclusion
Ultimately, it’s irrelevant whether you think the Fed should hike rates or not because it is doing so. Using the Fed’s logic and viewing alternatives helps you determine if the Fed will continue hiking rates or if it will slow them down. We’re getting close to a point where the Fed’s policy could be considered contractionary which means the bull market is close to ending. That’s why investors need to be focusing their attention on changes in the inflation data, which becomes the most important late business cycle metric.
Have comments? Join the conversation on Twitter.
Disclaimer: The content on this site is for general informational and entertainment purposes only and should not be construed as financial advice. You agree that any decision you make will be based upon an independent investigation by a certified professional. Please read full disclaimer and privacy policy before reading any of our content.


