UPFINA's Mission: The pursuit of truth in finance and economics to form an unbiased view of current events in order to understand human action, its causes and effects. Read about us and our mission here.
Reading Time: 5 minutes
We are making an adjustment to our economic thesis based on the latest data. We’ve been saying the decline in unemployment benefits hurt consumers, but they planned ahead which is why the initial impact on spending wasn’t severe. We’re changing that to say spending from those not getting unemployment benefits made up for those who are getting them. The table below shows ACH unemployment recipients had very large yearly growth declines in spending on clothing, home improvement, and general merchandise in the week of August 22nd as compared to August 1st. The growth declines were across the board.
Clothing has become more of a luxury than a necessity since people don’t need the latest styles if they aren’t going out/don’t have disposable income. Keep in mind, this period is the back to school shopping season which is the 2nd biggest consumer spending season of the year. Those not on benefits saw yearly growth improvement in all categories except home improvement, which had already been strong.
40 states have been accepted to give out the $300 to $400 in weekly unemployment benefits. Texas and Louisiana are among the 6 already giving out benefits. Texas is important because of its size and Louisiana is important because it was devastated by hurricane Laura. States are giving retroactive payments, so there might be a mini stimulative effect once those all go out. Unfortunately, back to school shopping will be over in September (stimulus coming too late). Obviously, not all students are going back to physical schools, so the picture is further muddied.
Latest Spending In Various Categories
In July’s retail sales report, there was some data suggesting the spending categories like clothing, which were hit the hardest, were improving quicker than average. That implies the areas that did well during the worst of the pandemic underperformed. The Bank of America data suggests we’re still seeing huge shifts in spending because of the pandemic. It shows yearly growth in spending on clothing and restaurants & bars fell 7% and 11%. Online spending on electronics was up 96%.
We know spending is eventually going to normalize once COVID-19 goes away. Therefore, this spending data signals the economy hasn’t normalized, not that this is the new normal. If you’re going to test the sustainability of the new trends since March, you need to see the virus go away. If you think the economy is permanently changed, either the virus will stay for years or the new way of doing things is superior. Again, testing the superiority will only come when there is a choice. When there is no risk of working in an office and people are still working from home, then you can say cities will be permanently changed and corporate real estate is in a long term downtrend.
This Is Similar To The Late 1990s/2000
There is extreme apprehension towards saying the 2020 bubble is just like the late 1990s tech bubble. That’s mainly because of recency bias as those calling for a bubble have been wrong for years. It’s impossible to time the top of a bubble, but if you’re off by 5 years or more, it was simply an incorrect call. The 2 biggest arguments that this isn’t a bubble are in the 1990s there were many companies without profits and there were many more tech IPOs. However, stocks that earn a profit can still be overvalued and there are a ton of EV and cloud companies that aren’t profitable. We don’t have as many IPOs, but we do have SPACs, a worse economy, and many large firms with much lower growth than the tech firms in the 1990s had.
In 4 of the past 10 days, there have been at least 0.5% gains in the Nasdaq while most of the stocks in the index fell. The highest ever was 5 out of 10 days in December 1999. Through 167 trading days this year, the Nasdaq 100 is up 64.1% which is the highest ever going back to 1985. The charts above show 2020 is nearly identical to 1999 in that large cap companies with the best stock momentum, direction of free cash flow margins, and sales growth have been rewarded, while value stocks have been discarded. We are in a historic moment in market history. We already had an extremely rapid bear market this year; now we have a bubble in large cap growth stocks.
Tesla’s Valuation Doesn’t Make Sense
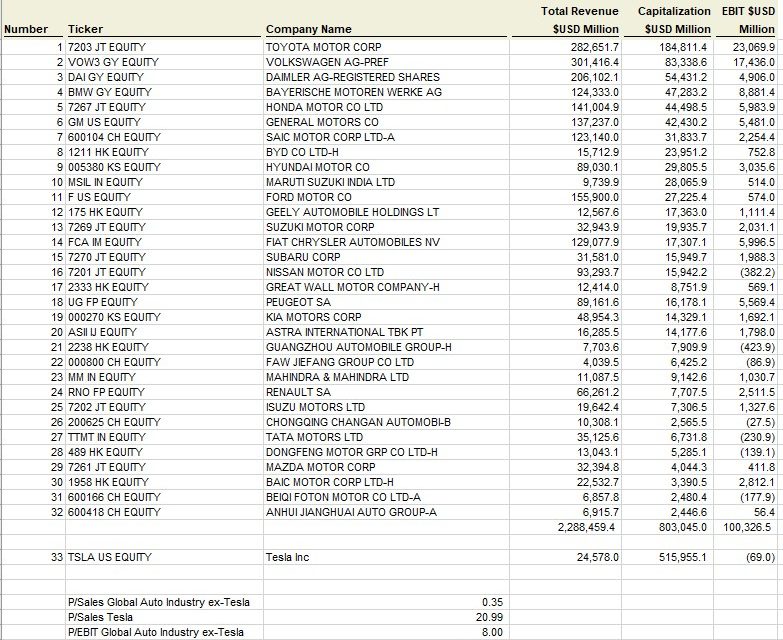
Tesla is the poster child for the 2020 tech bubble. This certainly is a great counterpoint to the notion that in 2020 the stocks that have done well are all profitable. Tesla’s valuation is so extreme, you can provide a good argument that it is a macro signal in itself. Specifically, the company has a diluted market cap of $516 billion (more than Visa) even though it only has $25 billion in sales and zero EBIT.
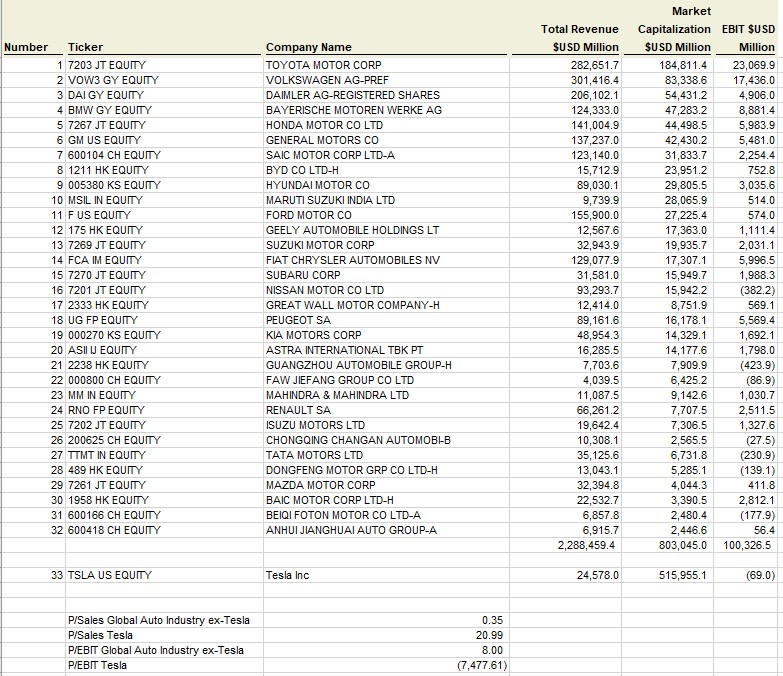
It’s generous to compare it to other car companies because Tesla’s car division isn’t profitable. The global auto industry has $2.3 trillion in sales and $100 billion in EBIT, but its market cap is only $803 billion. Traditionally automakers trade at very low multiples. Tesla’s goal is to have software-like margins with its autopilot, but until the service works, it shouldn’t get credit for that. Furthermore, even with 25% of customers buying autopilot, the company still wasn’t profitable last quarter if you exclude tax credits.
Sales & Price At Apple Don’t Mix
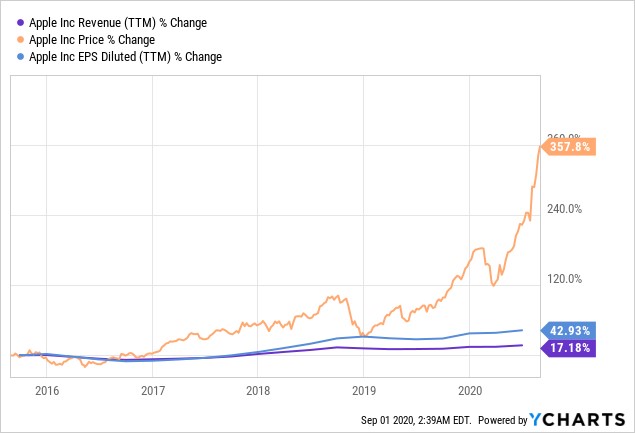
Apple is valued more than all the Russell 2000 companies combined. Yes, Apple is highly profitable unlike the stocks of the 1990s. However, the 1990s stocks had high growth, while Apple doesn’t. As you can see from the chart below, its share price is up 357.8% in the past 5 years, while its revenues are up 17.18%. To be fair to Apple, it bought back stock. Its diluted EPS is up 42.83% signaling there has been massive multiple expansion in a slow growth company. Apple’s free cash flow yield is only 240 basis points higher than the 10 year yield.
Conclusion
We were mistaken to say the stability of consumer spending was due to people saving up prior to the decline in benefits. People did save up, but those who are on unemployment insurance saw a big decline in spending. Those not getting benefits made up for them. Spending has still been vastly changed by COVID-19. Tesla’s valuation is nearly as high as the entire global auto industry despite having zero EBIT. Apple’s stock price has soared much more than its sales and diluted EPS in the past 5 years.
Have comments? Join the conversation on Twitter.
Disclaimer: The content on this site is for general informational and entertainment purposes only and should not be construed as financial advice. You agree that any decision you make will be based upon an independent investigation by a certified professional. Please read full disclaimer and privacy policy before reading any of our content.


