UPFINA's Mission: The pursuit of truth in finance and economics to form an unbiased view of current events in order to understand human action, its causes and effects. Read about us and our mission here.
Reading Time: 3 minutes
Everyone was wondering if retail sales growth would crash once the $600 in weekly unemployment checks stopped going out in August. The fears of a big decline in consumer spending were too pessimistic. More people are getting jobs. The people not on unemployment insurance increased their spending. We’ve seen steady improvement in Redbook same store sales growth. In the week of August 29th, there was a major breakout as growth rose from 0.6% to 4.6%, essentially bringing growth back to normal.
The improvement in same store sales growth throughout August wasn’t because of the $300 to $400 in weekly benefits going; few states are paying them out. As you can see from the charts above, there were hardly any lost wage payments in the week of August 28th. There is about to be an increase in payments in the week of September 4th. This might further bolster the solid trend in same store sales growth.
Besides these payments, the other key factor affecting the economy in September is the increase in COVID-19 testing due to Abbott’s new devices which give results in 15 minutes and costs $5. The government purchased 150 million tests which will be deployed throughout the rest of the year. The Trump administration will start administering the tests in mid-September. The effectiveness of this rollout will determine whether the economy can get back to normal.
Another Improvement In Manufacturing PMI
The ISM manufacturing PMI is now on a 4 month improvement streak as it rose from 54.2 to 56 in August which beat estimates for 54.5 and the highest estimate which was 55. Keep in mind, a PMI above 50 just means there was improvement from last month. There will likely be negative yearly manufacturing growth in August. Manufacturing growth rose from -10.9% to -7.5% in July. It will get closer to the flatline in August.
This is still a really encouraging ISM report because the headline reading makes it look worse than it was. Inventories sandbagged the PMI as inventories and customer inventories fell 2.6 and 3.5 to 44.4 and 38.1. We are seeing a drawdown in inventories and an increase in backlogs as the backlog of orders index rose 2.8 points to 54.6. This PMI is consistent with 3.9% GDP growth.
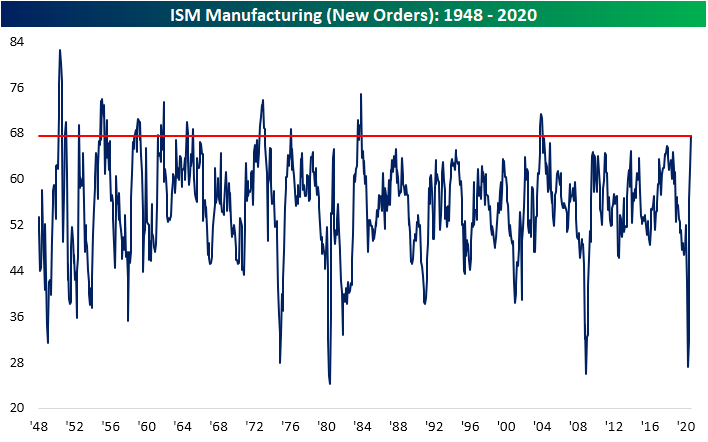
As you can see from the chart above, the new orders index rose 6.1 points to 67.6 which is the highest reading since January 2004. Production was up 1.2 to 63.3. Based on inventories and orders, we expect production to increase further in September. We could be looking at a strong manufacturing sector by the end of the year/early next year if the trend continues. The prices index was up 6.3 to 59.5. All of the top 6 industries had higher new orders. Obviously, there is huge dispersion in results in the sector as the airlines are doing terribly and the housing market is on fire. If Abbott’s testing works out, we could see a return to flying. We’ve seen domestic flights in China almost get back no normal. The economy can normalize once COVID-19 is at bay.
The VIX Anticipates Volatility
As you can see from the chart below, the VIX term structure anticipates an increase in volatility in September and October because of the election.
There is even a risk of delayed election results because of the unprecedented spike in mail-in voting because of COVID-19. It’s unlikely the virus is eliminated in time for the election. Mail-in voting starts this Friday. The expected volatility before this election is the highest for any election ever. While there are a limited number of possibilities of who can win, the mail-in situation is causing angst. Plus, there is a very overvalued stock market. Investors want to avoid this obvious pitfall. The question is if this risk is too obvious. Remember, initially Trump’s election was thought to be a disaster for stocks, but that reversed quickly.
The VIX is interesting for a number of reasons. It’s unusually high for a stock market at a record high. That might be because the stock market has increased so quickly; this VIX hasn’t been able to normalize. Also, the economy is still in a poor situation. It could fall back into a recession if COVID-19 cases increase again and the fiscal stimulus stops.
As you can see from the chart below, there is a dramatic difference between 21 day implied volatility and realized volatility. There is very little realized volatility with the stock market going up. However, traders keep expecting more volatility. This is the market’s “Waiting for Godot” moment. That’s a play where the main characters wait something that never arrives.
The Shorts Have Been Burned
It’s great to have shorts in a bull market because when the market corrects, the shorts cover. That provides a floor for stocks. There is no floor in this market as the put to call ratio is the lowest since at least 2004. The chart below shows Goldman Sachs’ most shorted basket. This group of stocks is up 116% since March and is near its record high.
Conclusion
Redbook same store sales growth has been steadily increasing despite the decline in unemployment benefits. The ISM manufacturing PMI improved for the 4th straight month. The VIX shows traders see volatility coming before the election. It hasn’t showed up yet even though mail-in voting starts on Friday.
Have comments? Join the conversation on Twitter.
Disclaimer: The content on this site is for general informational and entertainment purposes only and should not be construed as financial advice. You agree that any decision you make will be based upon an independent investigation by a certified professional. Please read full disclaimer and privacy policy before reading any of our content.


