UPFINA's Mission: The pursuit of truth in finance and economics to form an unbiased view of current events in order to understand human action, its causes and effects. Read about us and our mission here.
Reading Time: 4 minutes
Households own a large amount of stock. As of Q1 2019, U.S. households had $124.7 trillion in assets. $88.9 trillion of that is financial assets, $17.5 trillion is corporate equities, and $8.8 trillion is mutual fund shares. In Q1, equity allocation was 29.6% which is below the cycle high of 31.3% in Q3 2018 because of the correction in Q4 2018. Interestingly, the allocation fell to 27.7% in Q4 and that is equal to the Q2 2007 peak. The only higher peak than Q3 2018 was in the late 1990s/early 2000s. Keep in mind that through inductive reasoning we can see that this high allocation isn’t necessarily a problem. That’s because valuations are more important than how much stocks U.S. households own. U.S. households aren’t the only buyers of stocks.
Big Changes To Household Net Worth
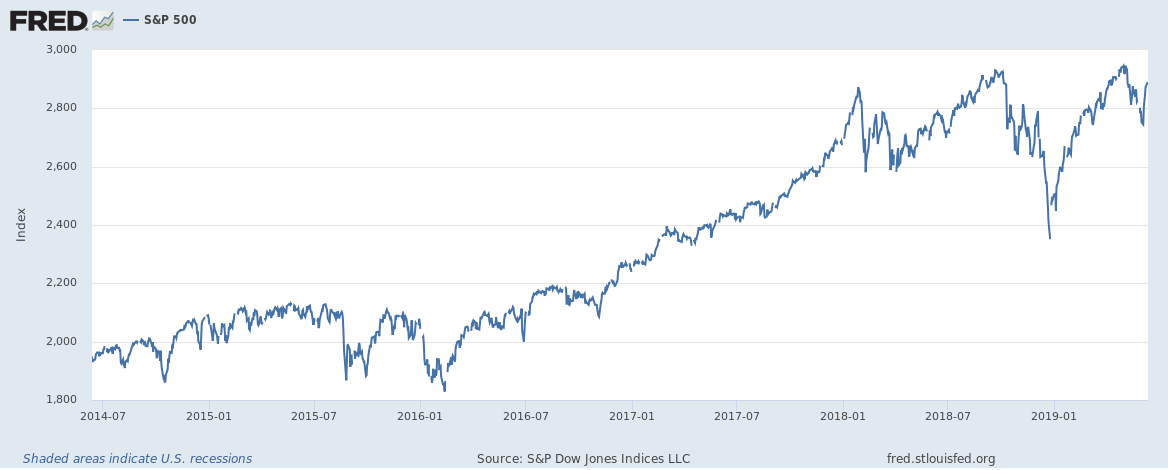
The point here isn’t that the stock market is in a bubble that is about to collapse. Rather, it’s about how important the stock market has become to the economy. The reflexivity theory, which explains how the market can affect the economy, is in full force given how much money consumers have in equities. It’s more important for politicians and policy makers to keep the market up than almost ever before. Perma bears who are skeptical of the Fed hate when the Fed ever reacts to the stock market. The reality is stocks reflect expectations and impact the economy. If the Fed didn’t care about the stock market, it would be a mistake.
As you can see from the chart above, in Q4 2018, the change in household net worth as a percentage of disposable income had the largest decline since the 2008 financial crisis. Furthermore, the increase in Q1 was the largest single quarter jump since the tech bubble. That’s what happens when households own a lot of stock and the market has major moves to the downside and upside.
Small Business Confidence Improves
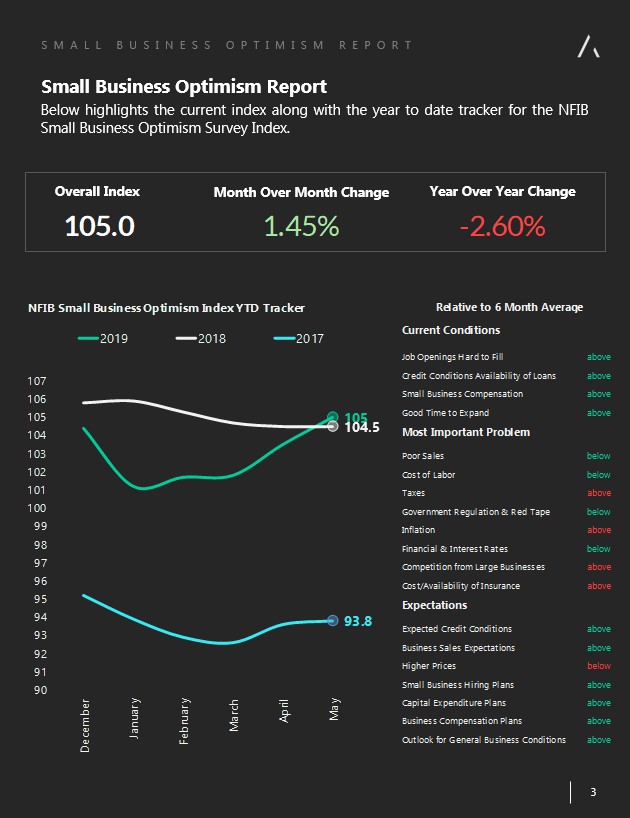
Despite the May 10th Chinese tariff announcement and the decline in stocks, the May NFIB small business confidence index increased from 103.5 to 105 which beat estimates for 102 and the high end of the consensus range which was 103.5. The November 2018 elections had a bigger negative impact on the index as small businesses in this survey tend to be biased in favor of the GOP. Don’t be fooled by the negative yearly change shown in the graphic below, this index has been headed higher. It is up 4 straight months and the 2019 year to date tracker recently crossed over that of 2018. As you can see, expectations also have improved in the past couple months.
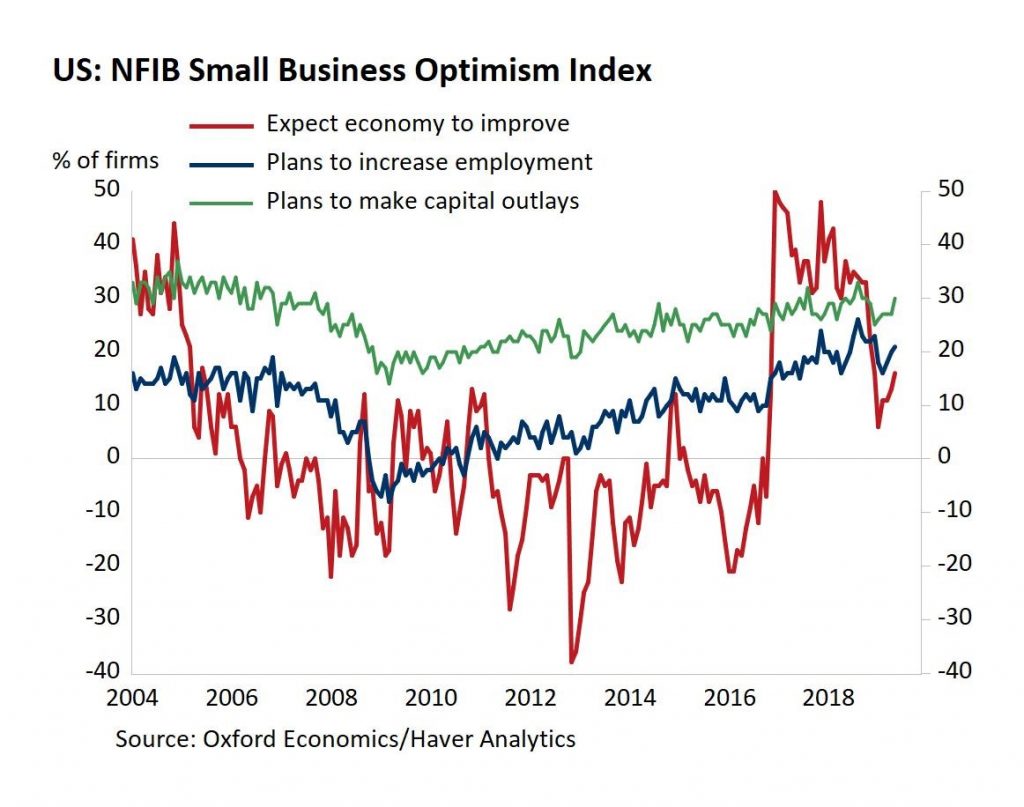
Specifically, in May there were 6 components that were up monthly, 3 that were stable, and 1 that was down. The component with the biggest increase was the net percentage who said now is a good time to expand. That was up 5 points to 30%. As you can see from the chart below, the net percentage of small businesses expecting the economy to improve and the net percentage of them with plans to make capital outlays were both up 3% to 16% and 30%.
13% of companies stated they were uncertain about the future because of the political climate. That is likely because of the trade war. If the trade war were to end, more small businesses would expect the economy to improve which would push the overall index near a new record high.
PPI Final Demand
We must take a new look at inflation with the understanding that the Fed is being pressured to cut rates this year. When core inflation is near 2%, it’s completely fine if the Fed doesn’t plan to change rates. However, when the Fed plans to cut rates, core inflation at about 2% is a problem. The Fed conveniently looks at core PCE inflation which is usually the lowest inflation calculation. Since March 2012, core PCE inflation has only been above 2% once. As you can see from the chart below, the situation is dicier if you look at PPI. May core PPI fell from 2.4% to 2.3% and core PPI without transportation services was up from 2.2% to 2.3%.
The inflation situation is good for workers, but bad for the Fed because headline inflation has been limited by energy and food. Workers pay for all costs, but the Fed ignores energy and food. In the PPI report, energy prices were down 1% monthly and 3% yearly. Food prices fell 0.1% and were up just 1.2% yearly.
Trade services prices were down 0.5% which is the 3rd decline in 4 months. Excluding trade services, personal consumption prices at the producer level were up 0.5%. They were up 0.2% on a headline and core basis. As you can see from the chart below, PPI selected healthcare services inflation, which is correlated with PCE healthcare services inflation, showed SAAR growth of 3.8% from April to May. That’s up from SAAR growth of 0.5% from January to March. That supports the possibility core PCE inflation will be boosted by healthcare.
The Fed would be in a major predicament if it based policy on core PPI because it’s above 2%. By cutting rates, the Fed would be hoping inflation would continue to fall. The act of cutting rates helps inflation, so that might not happen. If the Fed was planning to cut rates, inflation might be considered too low. However, policy expectations have radically changed in the past 10 months. There were expectations for 3-4 hikes in 2019 and now there are expectations for 2-3 cuts.
Conclusion
The economy is more leveraged to the stock market than almost ever before. However, small business confidence increased in May despite the decline in the stock market. That correction wasn’t as big as the 20% decline late last year. Don’t be tricked by the bears by looking at yearly growth in the NFIB index. The index is historically high and up 4 straight months. The index is up year to date compared to last year. Core inflation is higher than headline inflation because of weakness in food and energy prices. Lucky for the Fed, it follows core PCE which has almost never been above 2% in the past 7 years.
Have comments? Join the conversation on Twitter.
Disclaimer: The content on this site is for general informational and entertainment purposes only and should not be construed as financial advice. You agree that any decision you make will be based upon an independent investigation by a certified professional. Please read full disclaimer and privacy policy before reading any of our content.


