UPFINA's Mission: The pursuit of truth in finance and economics to form an unbiased view of current events in order to understand human action, its causes and effects. Read about us and our mission here.
Reading Time: 4 minutes
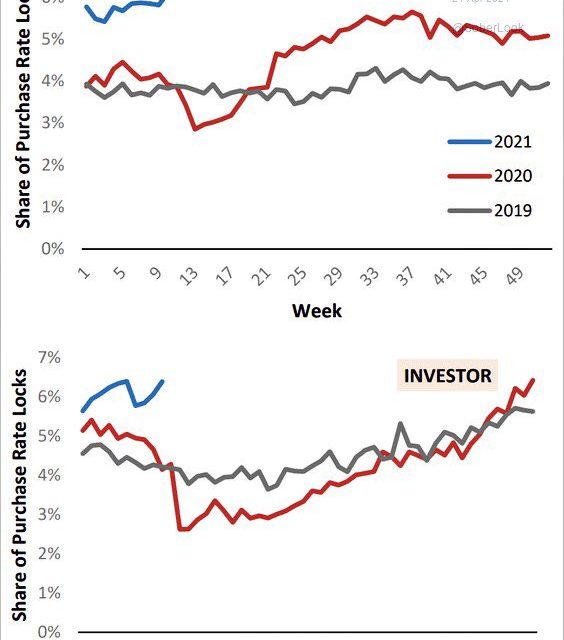
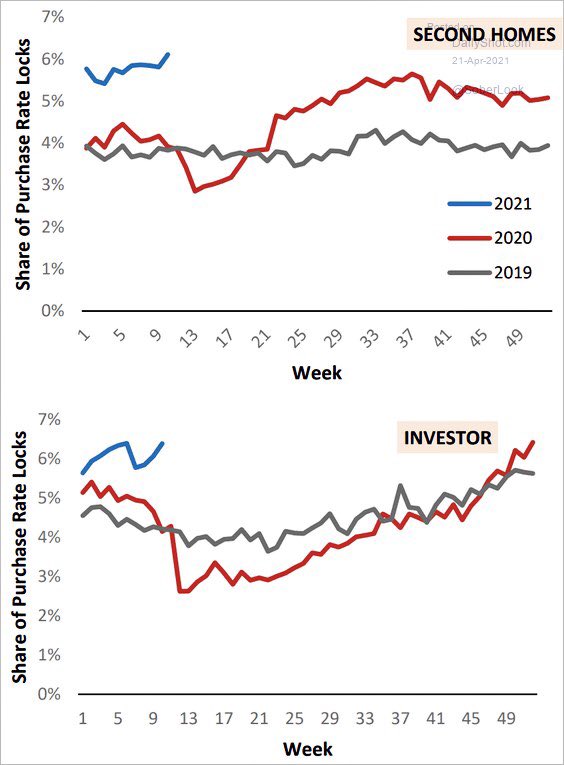
The housing market is hot because of low interest rates and demographics (millennials turning 30). Those are the main catalysts. The secondary catalysts are people buying 2nd homes and investors entering the market. As you can see from the top chart below, there was a large spike in 2nd home buying a few months into the pandemic. People wanted to buy a 2nd home to get away from the city where the pandemic spread the quickest.
For some people, this was very reactionary. They even bought houses sight unseen. It was/is a mad dash to buy a house which probably wasn’t the smartest idea. Buying a house takes a lot of planning. There is no reason to buy a house just to escape the city unless you plan on it being a long term move. You should keep a house for at least 7 years if you plan to buy it, as a rule of thumb. 12 months ago, some probably didn’t realize this pandemic wasn’t going to last many years. It became the new normal; people adapted.
The share of 2nd home purchases has spiked to about 6% which is a little over a 2% increase from 2019 levels. Furthermore, the share of investors buying homes has increased in the past few months. This has been more delayed than the spike in 2nd home buying. It only got above 2019 levels at the end of last year. These are people who are late to the game. Investments become the most popular after large moves. It’s probably not a great time to buy a house for investment purposes given the spike in prices. Location is always the most important aspect of real estate investing, but if rates were to spike almost every area would see a correction. Absent a very large spike in rates, we will only see a decline in the rate of price growth, not absolute declines.
Consumer Spending Growth Decelerates
Spending growth is declining quickly because it never could keep that pace up. The April retail sales report will be fantastic. Month over month growth will definitely fall in May. We can’t look at yearly growth because the comps are about to get much harder compared to where they were a few weeks ago. However, 2 year growth is also slowing rapidly. As you can see from the chart below, ex-auto Bank of America card spending growth over 2019 levels has fallen to just 18%. That’s still very strong though. We’d be impressed to see double digit (2 year) growth in the next few months.
The chart below shows the same data except its from Chase cards. As of the week of April 21st, the 2 year average spending growth rate has fallen to 5.9%. Growth is -7.8% from before COVID-19. The pre-COVID-19 level might be a tough comparison. However, the overarching theme is spending is still strong, but decelerating as one would expect. It was impossible to maintain the growth rate seen in the 1st half of April.
There could be another stimulus, but that’s uncertain. The next catalyst will be the elimination of COVID-19. Right now, most things are open, but life isn’t back to normal. We need to see more vaccinations to get everyone back to the office for instance.
As of April 20th, 40.6% of Americans have had 1 dose and 26.3% have been fully vaccinated. COVID-19 has been almost perfectly eliminated in Israel. As of the 20th, the 7 day average of deaths was 5 and the 7 day average of cases was 154. Israel’s vaccination rate has stopped increasing, but that doesn’t matter because the pandemic is almost 100% over there. 59.2% of the country has been vaccinated and 55.1% has had 2 doses. If America needs to get to a 60% vaccination rate for a return to normalcy, we should be just a few weeks away from that.
What Drives Stock Returns
There is some controversy over the data on what drives returns. Analysis shows 74% of 10 year total returns is driven by sales growth. That is based on the top quartile of S&P 500 companies from 1990 to 2009. That’s a pretty reasonable timeframe because from 2003 to 2007 value stocks did really well and from 1998 to 1999 growth stocks did exceedingly well. Critics say this chart is just bunk linear regression of the growth factor, which isn’t accurate.
Of course, you have to keep in mind that companies in the S&P 500 are usually profitable. This means the money losing growth stocks with high sales growth don’t count. Some investors are using this analysis to support their flawed thinking that valuations don’t matter on companies with high sales growth. That’s because the chart shows only 5% of 10 year returns were driven by multiples in this study. However, there is little justification for buying structurally unprofitable companies at 20 times sales. That’s a poor long term strategy.
The graphic above shows what goes into equity performance. This is much more detailed than the chart that shows the importance of sales growth. Of course, this shows the drivers of overall US equity returns in the past 30 years, not individual companies. Some will say that this analysis backs into the returns. Oftentimes, sell side analysts will create price targets that are 15% higher than the current price. They are goal seeking rather than truth seeking. Their analysis might be right, but the price targets should usually be ignored because of this.
Conclusion
The housing market is mostly driven by demographics and low rates, but it’s also being helped by those buying 2nd homes and investments. It’s probably a bad time to invest in US housing given the large price increases and the popularity of the investment. However, we aren’t about to see a crash in prices unless rates spike. We are more likely to see low price growth. Consumer spending growth is falling, but it’s still strong. Sales growth drives long term stock returns, but that doesn’t mean you should pay high sales multiples for money losing companies.
Have comments? Join the conversation on Twitter.
Disclaimer: The content on this site is for general informational and entertainment purposes only and should not be construed as financial advice. You agree that any decision you make will be based upon an independent investigation by a certified professional. Please read full disclaimer and privacy policy before reading any of our content.


