UPFINA's Mission: The pursuit of truth in finance and economics to form an unbiased view of current events in order to understand human action, its causes and effects. Read about us and our mission here.
Reading Time: 4 minutes
The May jobs report was solid, but unspectacular. April’s reading was revised up like we expected, but not by much. It was pushed up by 12,000 to 278,000 which means it was still very disappointing. In May there were 559,000 jobs added which moderately missed estimates for 650,000 jobs added. If job creation stays at this pace, it will take until July 2023 for the economy to recover all the jobs lost in the recession and the jobs that would have been added had job creation continued at the prior rate. Double this rate would get those jobs back by April 2022 which had been our prediction.
As you can see from the chart below, Oxford Economics believes the labor market will get to the pre-recession level (not adding in trend growth) mid to late next year. They think job creation will be strong in the next few months before normalizing right before gaining all the jobs back. It’s worth noting how much quicker jobs are being recovered compared to the last recession.
Some folks are mad that the stock market has more than recovered its losses while the labor market still isn’t back to normal. Firstly, stocks price in the future. They should be happy stocks are going up because that means investors believe the economy will improve. Secondly, it’s not true that investors don’t want the labor market to improve. The best situation for investors is the one we are in now: elevated and declining unemployment. Investors want more jobs to be added.
Where The Jobs Were
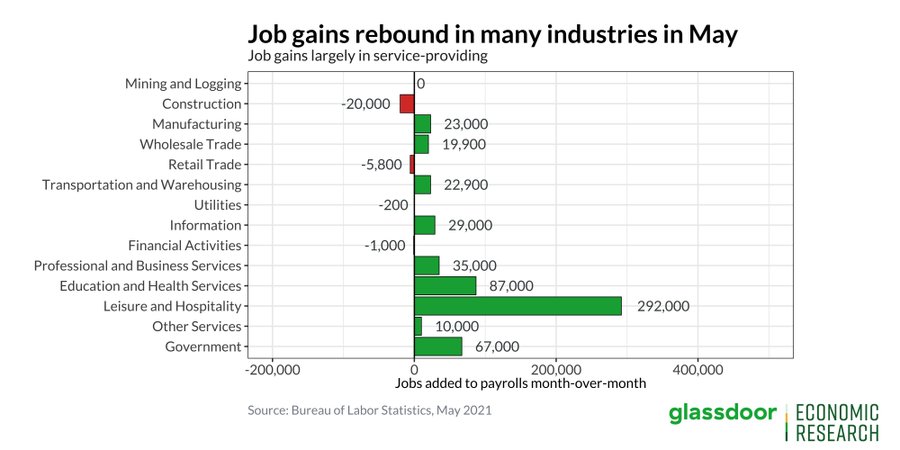
492,000 private sector jobs were added which means there were more government jobs added than expected. 67,000 were added which was above estimates for 25,000. Only 23,000 manufacturing jobs were added which missed estimates by 14,000. Plus, last month’s reading was revised down by 14,000 to -32,000 which means there were net losses in April & May combined even with the strong PMI.
As you can see from the chart above, the leisure and hospitality industry added 292,000 jobs as the economy normalized. Spending at restaurants has returned to normalcy and travel is returning quickly. The industry is still down 2.5 million jobs (15%) from its prior peak. We have at least another 6 months of strong job creation coming from this industry.
The 2nd strongest category was education and healthcare which added just 87,000 jobs. Education (public & private) added 144,000 jobs, but it’s still down 1.093 million jobs from before the pandemic. Let’s see if all the jobs come back in August and September when people go back to school. Healthcare employment was up 23,000 jobs; it is missing 508,000 jobs compared to before the pandemic.
Unemployment Rate Falls
The unemployment rate fell from 6.1% to 5.8%. The labor force fell by 53,000 people. The labor force participation rate fell 1 tenth. There was a 444,000 increase in the number of people employed and a 496,000 decrease in the number of people unemployed. Finally, there was a 160,000 increase in those not in the labor force. The underemployment rate fell 2 tenths to 10.2%.
For the 3rd month in a row, the prime age labor force participation rate stayed at 81.3%. There was a sharp decline in the number of people permanently unemployed. It fell from 3.529 million to 3.234 million which was the lowest reading since July 2020. The number of temporary job losers decreased from 2.114 million to 1.823 million.
There was a weird quirk in the employment to population ratio among younger workers. As you can see from the chart below, the employment to population ratio of those 16 to 19 years old rose 4 tenths to 33.2% which was the highest reading since it was 34.1% in May 2008. It has taken us more than a decade to claw back the losses in the Great Recession. The difference between the prime age employment to population ratio and the teenage ratio is the smallest since January 2007.
Strong Wage Growth
The length of the work week stayed at 34.9 hours (revised down 0.1 last month). The record high was in January at 35 hours. Hourly wage growth was 2% on a yearly basis which beat estimates for 1.5%. It rose from 0.4% due to major comp changes. Wage growth for private non-supervisory workers spiked from 1.2% to 2.4%. Growth will get stronger in the next 2 months due to weaker comps and the tighter labor market.
As you can see from the chart below, wage growth in the leisure and hospitality industry spiked to 8.8% which was by far a record high. The comp was easy. Plus, it’s somewhat tough to find workers in this industry in part because of pandemic worries. Maybe some employees don’t want to go back to work at places that just fired them. Maybe they don’t want to deal with the stress associated with pent up demand swamping them.
We push back on the notion that stocks are doing amazingly while workers are getting hurt. Weekly earnings have spiked since the pandemic. This acceleration is different from the deceleration in the prior recession. Average weekly earnings growth increased from 2.4% to 2.6%. The 2 year growth stack was 10.2%. In February 2020, average weekly earnings growth was 3%, but the 2 year growth stack was only 6.2%. Clearly, a few industries haven’t fully recovered, but it’s unusual for the labor market to be back to normal 1 year after a recession. In due time, the economy will be back to normal.
Conclusion
The May labor report modestly missed estimates which was different from the huge disappointment in April. This report actually had a bigger impact on the 10 year yield than the last one. The bond yield fell from about 1.61% to 1.55% on Friday. Stocks didn’t care at all. The S&P 500 rose 88 basis points to within 6 basis points of its record high. The leisure and hospitality industry improved again, but it’s still 15% below where it was before the pandemic. Teenage jobless was the lowest since 2008. Wage growth was solid.
Have comments? Join the conversation on Twitter.
Disclaimer: The content on this site is for general informational and entertainment purposes only and should not be construed as financial advice. You agree that any decision you make will be based upon an independent investigation by a certified professional. Please read full disclaimer and privacy policy before reading any of our content.


