UPFINA's Mission: The pursuit of truth in finance and economics to form an unbiased view of current events in order to understand human action, its causes and effects. Read about us and our mission here.
Reading Time: 6 minutes
In this article we will discuss some potential ideas for investors to consider and logical mistakes some investors are making. The goal is to give you starting points for investing ideas as well as to help you avoid making mistakes which can distort your outlook on the market. There are almost always false narratives within the financial press and investor community which are easy to fall prey to. Poor narratives stem from lazy research masquerading as in-depth analysis, thus making it tough to decipher. Headlines repeat a narrative and charts reinforce that mistake. It can turn into one of your assumptions without you realizing it. That’s why it’s critical to read unbiased in depth analysis, understanding both arguments for and against. There are no black and white answers.
Are Defense Stocks Overvalued?
One potential idea investors should consider doing further research on is the high valuation of defense stocks. The chart below shows the historical relative valuation of the defense sector compared to the S&P 500. As you can see, the valuation metric used is the Enterprise Value to EBITDA ratio.
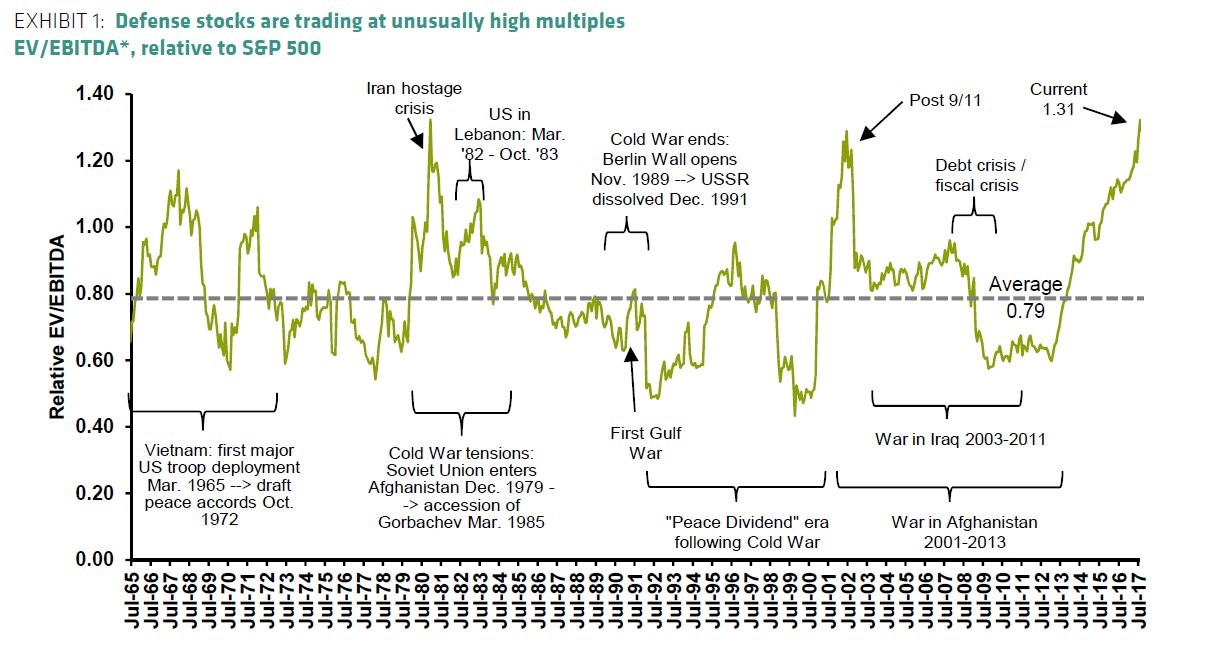
Defense Sector Valuation Relative To The S&P 500
The average ratio since 1965 is 0.79. This shows how the market usually values this sector less than other sectors probably because of the uncertainty factor of their earnings projections. You might associate defense stocks as ones investors reach for in times of geopolitical peril making them appear to be consistent, but the possibility of war is very volatile making their earnings and stocks jump around a lot. You can see the changes in the relative valuations labeled with each conflict below. The valuation that jumps out at you is the recent action. The current valuation is near the highest in 52 years. Keep in mind the current S&P 500 valuation is already stretched as the Schiller PE multiple is nearly double the long term average.
This valuation metric need to be contextualized. As you can see, no major wars are highlighted because the world is at peace, relatively. We aren’t minimizing any current conflicts, we’re just speaking mathematically. This is like how saying the economy is strong doesn’t minimize the suffering of the poor. The other aspect to contextualize is the defense budget. The U.S. spends more on defense than the next seven biggest spending nations combined. America should be the focus because of that and because the defense companies in the S&P 500 serve US interests. This brings us to the chart below.
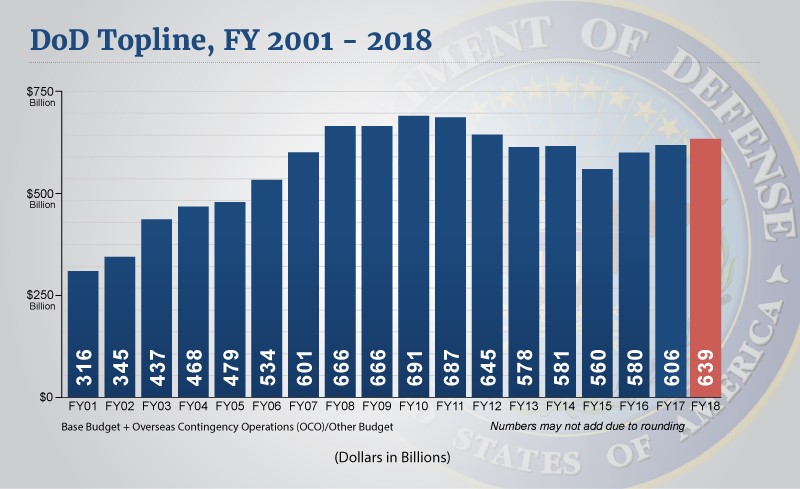
Top-line Spending At The Department Of Defense
Even without the impact of a major war, the top-line defense budget will increase in 2018 because of President Trump’s budgetary goals. If you compare the budget to the relative valuation of the defense sector, it looks like the defense stocks started rallying before the budget started to increase, implying there’s more to the story.
The chart below gives you an alternate valuation of the sector. It shows the global mid to large cap defense stocks’ price to book value. As you can see, it is at a 22 year high.
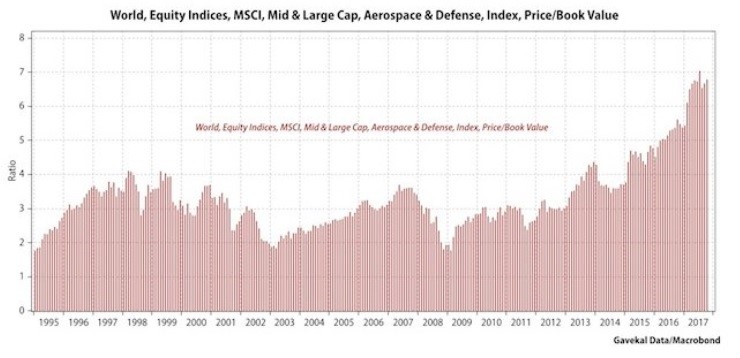
Price To Book Value Of Global Mid To Large Cap Defense Stocks
Besides Trump’s penchant for spending more on the military, the threat of a war with North Korea and Iran are on the table. When doing a macro analysis, you need to look at all these factors to conclude what your portfolio’s sector weighting for defense should be. This section of the article is meant to give you a briefing on the latest trends to help you launch your own research to see if a trading/investing opportunity is available.
Energy Stocks & Oil Diverge
There has been a sharp rally in oil prices in the past few months, but energy stocks haven’t done anything in the past 2 months which is peculiar. The profitability of oil firms is dependent on the price of the commodity, but they don’t always move in tandem. The chart below shows the historical price of WTI as compared to the performance of energy stocks relative to the S&P 500. The last divergence like this happened before the price of oil collapsed in late 2014.
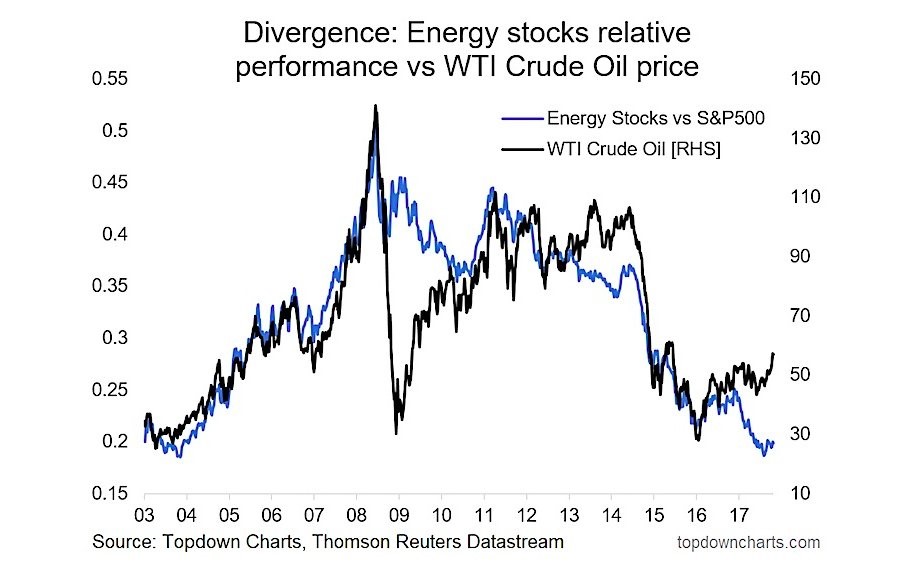
WTI Oil Rallies While Energy Stocks Don’t Move
Traders who are buying oil are speculating that OPEC will extend its production cuts for the rest of 2018. The current cuts end in March of 2018. The next OPEC meeting is on November 30th. The key aspect will be getting Russia on board with the extension. Currently Russia thinks it’s too early to decide. Oil will fall if no cuts are made. The fact that the oil rally is so precarious might be why oil stocks haven’t rallied. Energy firms rallying would be confirmation that the bullish trend is valid. The chart below shows the current speculation in WTI. The net longs are higher than in 2014 before oil crashed. We’re not saying oil will crash again; we’re just pointing out chart patterns.
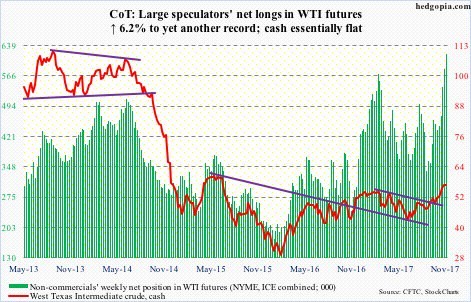
Net Long Speculation In WTI Is High
The chart below is some fundamental analysis to keep in mind when making your investing decision on the energy sector. The Return on Invested Capital is barely positive, but the Free Cash Flow has rebounded nicely. These metrics both rely on the price of oil.

S&P Energy ROIC & FCF
False Narratives About Excessive Risk
One of the narratives the bearish investors like to promote is that there is excessive optimism in the stock market. Stocks are expensive, but that doesn’t mean much for short term returns. That’s why the bears need to promote the concept that there is so much speculation that the market can fall any day. The chart below has been shown by bearish investors without the red line showing subsequent 3 year returns. When you don’t look at returns the chart makes it look as though the market is going to fall because the net percentage of fund managers that are taking more risk is at the highest point ever. However, when you use the red line to look at returns, you can see excessive risk doesn’t correlate with weak returns, making this narrative bunk.
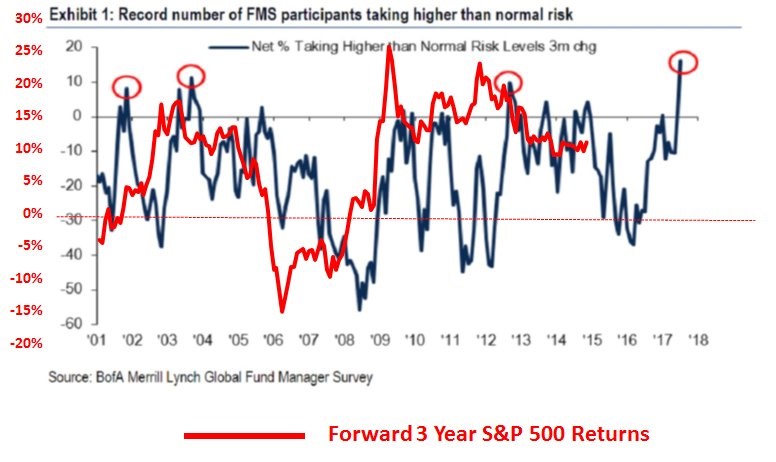
Excessive Risk Doesn’t Imply Low Stock Returns
The other supporting point the bearish investors make is that there is excessive margin debt in relation to GDP, implying that speculation is at a record high. That’s a faulty point because margin debt has no relationship to GDP. Margin debt is borrowing money to speculate in stocks. GDP measures economic output. A better comparison is seen below. It compares the margin debt to the Wilshire 5000 market cap.
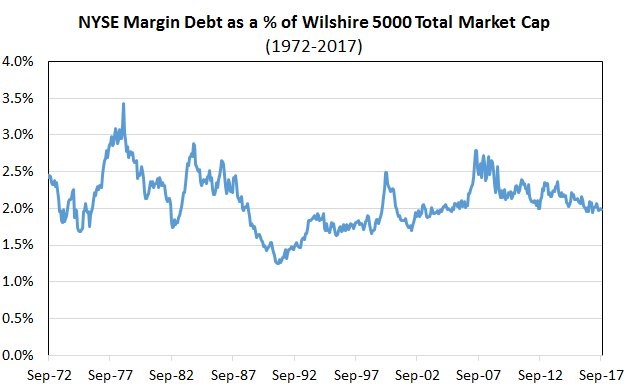
Margin Debt Isn’t High
This shows that there isn’t excessive risk taking in stocks. The difference in these metrics comes down to the fact that the stock market is high relative to GDP. However, that’s because margins are high and because 30% of S&P 500 revenues come from abroad which means stocks can rally more than U.S. GDP growth. One aspect that makes the current high margins more sustainable than in the past is the fact that software firms have high margins. To be a part of the bearish crew you need to think global growth relative to the US will slow and software margins will come down. That’s possible, but it doesn’t make comparing margin debt to GDP valid.
Conclusion
The goal of this article was to show recent trends in the defense and the energy sector. You must now do your own research on the sectors with this article providing you with an objective review of both positives and negatives. We also showed how common bearish narratives are false premises designed to arrive at a conclusion that is predetermined. When it comes to investing, nothing is black and white. The truth is generally somewhere in the middle.
Have comments? Join the conversation on Twitter.
Disclaimer: The content on this site is for general informational and entertainment purposes only and should not be construed as financial advice. You agree that any decision you make will be based upon an independent investigation by a certified professional. Please read full disclaimer and privacy policy before reading any of our content.


