UPFINA's Mission: The pursuit of truth in finance and economics to form an unbiased view of current events in order to understand human action, its causes and effects. Read about us and our mission here.
Reading Time: 4 minutes
It appears the labor market is steadily improving despite fears of a slowdown. Keep in mind, it’s very scary to look at the current picture, but rate of change is what matters. Furthermore, stocks actually do better when the unemployment rate is high. There is nothing wrong with learning about the struggles people go through in recessions. Economics is about individual stories. However, when it comes to investing, these stories probably won’t help you make money.
Support for the thesis that the labor market improved on a rate of change basis in August was the ISM services employment index which rose 5.8 points to 47.9. It’s interesting that it’s still below 50 which means contraction. Given the strong July labor report with a 42.1 reading, worrying about it being below 50 doesn’t seem useful.
Jobless Claims Nuance
There’s a lot of nuance when it comes to the jobless claims report from the week of August 29th. Seasonally adjusted unemployment claims fell from 1.011 million to 881,000. However, there was a change to the seasonal adjustment which pushed claims lower. The previous readings are not consistent with this new calculation and the prior readings aren’t going to be updated. Since we already knew ahead of time that claims would fall because of this change, it makes no sense that the consensus was for 958,000. Despite this improvement, the situation likely worsened slightly since non-seasonally adjusted claims rose from 826,000 to 833,000. We were focusing on non-seasonally adjusted data more often in the past few months anyway because this recession made seasonality less important.
PUA initial claims spiked 152,000 to 760,000. As you can see from the chart above, that caused the non-seasonally adjusted combination to rise 11% from last week. However, 146,000 of the increase in PUAs came from California. This may have been a data dump, which means data from a few weeks were combined into one. Since the increase was mainly caused by one state, this spike likely isn’t a trend.
We’d argue this was a good report despite the NSA increase because continued claims fell sharply (week of August 22nd). Seasonally adjusted claims fell 1.238 million to 13.54 million. At this rate of decline, it would take 6 weeks to get back to the peak of the financial crisis. That’s with the unemployment rate falling below the financial crisis peak of 10% in August. Non-seasonally adjusted continued claims fell from 13.87 million to 13.1 million which was the 5th straight weekly decline. The labor market is steadily improving despite the lower fiscal support. Once the labor market gets better than the worst of the financial crisis, fiscal support will be less necessary especially if Abbott’s fast responding mass testing works. The 7 day average of daily deaths fell to 898 on Thursday.
Challenger Job Cuts
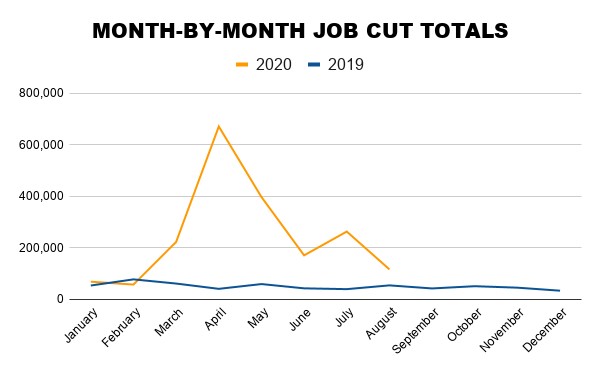
Challenger job cut announcements in August fell from 262,649 to 115,762. Don’t get afraid of the headline that says there have been more cuts in 2020 than every year in the history of this report. As you can see from the chart below, those cuts mostly came in the spring. The labor market is now improving. The 116% increase in August from last year doesn’t matter either because of the sequential improvement. The big states have had the most layoffs in 2020. California had 355,661 cuts this year. New York and Florida had 215,251 and 183,532 cuts. The fact that they had some of the worst effects of COVID-19 certainly pushed those cuts higher.
Entertainment and leisure had the most cuts in 2020 out of any industry as there were 799,051. This industry has the most to gain from Abbott’s new test. 1.083 million cuts were due to COVID-19 in 2020. There were 160,411 job hires announced in August which is up from 24,937 last year, but down from 246,507 in July. This is the most new hires in an August since at least 2015.
Small Business Hiring
The ADP report showed small business hiring was the weakest (out of each business size) in August. ADP has been wildly underestimating job creation since the recession started. They should fix their survey method. As you can see from the charts below, the NFIB data looks strong. The net share planning to hire rose to 21 in August which is where it was before the recession. The net share with openings hard to fill rose to 33%.
The small business pulse survey doesn’t look as strong. In the last week of August, the sentiment index didn’t improve. The good news is from the last week of June to the last week of August, it went up from -0.57 to -0.51. There was virtually no sequential change in the labor market. 6.6% businesses increased hiring and 10.7% decreased hiring. The net effect depends on the size of the firms in each category.
Chase Spending Stuck
Redbook same store sales growth in August steadily improved. Chase card spending growth has been stagnant since mid-June as you can see from the chart below. The good news is the decline in unemployment benefits didn’t cause a decline in card spending growth August. More people are getting jobs. Once the economy fully opens up, more spending will be available. There will be more vacations, business travel, concerts, indoor dining, etc. These is some pent-up demand because the savings rate is so high. A combination of Abbott’s test with the $300 in weekly unemployment benefits kicking in could cause spending growth to spike in the 2nd half of September.
Conclusion
The labor market data looks good. Continued claims have fallen 5 weeks straight, the ISM services employment index spiked, job cut announcements fell in August, and small business hiring plans improved. Spending data is a mixed bag with Redbook same store sales growth normalizing and Chase card spending growth stagnating in the past 2.5 months. Retail sales will be the tiebreaker. Once the economy normalizes, the pent-up demand for group activities like going to concerts and sporting events will spike consumer spending.
Have comments? Join the conversation on Twitter.
Disclaimer: The content on this site is for general informational and entertainment purposes only and should not be construed as financial advice. You agree that any decision you make will be based upon an independent investigation by a certified professional. Please read full disclaimer and privacy policy before reading any of our content.


