UPFINA's Mission: The pursuit of truth in finance and economics to form an unbiased view of current events in order to understand human action, its causes and effects. Read about us and our mission here.
Reading Time: 4 minutes
Monday’s trading session was one for the ages. It was logical yet insane. The best indication of the wild action is that the Eurodollar curve started to forecast a rate hike in 2024. It’s not crazy to foresee rate hikes within the next few years even though the Fed is about as dovish as it can be. That’s how much things hinge on vaccines and therapeutics allowing the economy to reopen. At its Fed meeting in October, Powell said “Is monetary policy out of power or out of ammunition? The answer to that is no, I don’t think that. I think that we’re strongly committed to using these powerful tools that we have to support the economy during this difficult time for as long as needed and no one should have any doubt about that.” He doubled down on being dovish yet now the market sees a hike.
This is the exact reversal from a couple weeks ago. In late October, the stock market fell due to the spike in COVID-19 cases despite great earnings. The theory was that the future wasn’t as good as the past because of COVID-19. Either shutdowns or behavior shifts were coming. Those are still coming, but with a vaccine, we can see the light at the end of the tunnel which caused the 10 year yield to spike 12 basis points to 93.5 and the curve to steepen. Rates hikes even sooner could start to be priced in if optimism on the reopening continues. Some macro enthusiasts say the Fed can’t hike rates. In reality, the Fed can’t keep rates at zero if the market pushes it (in a couple years).
Many Crazy Stats From Monday
There were so many records and movements that hadn’t happened in years on Monday. This was one of the craziest days of the year which is saying something because 2020 is one of the craziest years in market history. World value stocks beat world growth stocks by over 4% which was the most in history (going back to 1998). The FAANG+ stocks underperformed the S&P equal weight by over 7% which was the most ever (back to late 2015). Energy had its 3rd best day in the past 25 years.
The Dow beat the Nasdaq by the most in 20 years (tech bubble era). Momentum stocks fell the most ever (since 2008). Those are correlated with the work from home software stocks. The banks were up over 10% and the Nasdaq was down more than 1.5% for the 2nd time ever. The only other time that happened was the 2009 bottom. High beta stocks beat low beta stocks by the most ever (2002). The duration plays with high PE ratios and low volatility crashed due to the spike in the 10 year yield. Cheap stocks beat expensive stocks by the most ever (2002). That’s because the banks and energy rallied while tech sold off. The regional bank index (KRE) was up 15.4% which was its 2nd best day ever. The energy services ETF (OIH) rose 18.9%, while the cloud index (CLOU) fell 4.9%.
Topping Signal?
Of course, everyone wants to know what this crazy action means. Everyone wants to assign meaning to short term action because they want to think the stress was worth it. It’s not fun to imagine stocks did all this only to reverse course the next few days. No one knows what the future holds, but the action this year has been very similar to the late 1990s and 2000 when the Nasdaq topped. The Nasdaq 100’s top on September 2nd could easily mark a top for years. As you can see from the chart below, the equal weight S&P 500 beat the Nasdaq 100 by over 5%. This happened numerous times during the bubble period (before & after). It hadn’t happened since the early 2000s around when the Nasdaq bottomed.
There was only a certain amount of underperformance the Nasdaq could take in the 2000s. That reminds us of value stocks now. They entered the recent rally in the 0th percentile as a factor. As you can see from the chart below, the energy sector beat the Nasdaq by the most in one day ever. In the lead up the tech bubble peak and afterwards, there were a bunch of ‘factor days’ where either energy or tech had massive divergences. That’s the same as this year. This movement has been more compact and more divergent.
Expensive Stocks
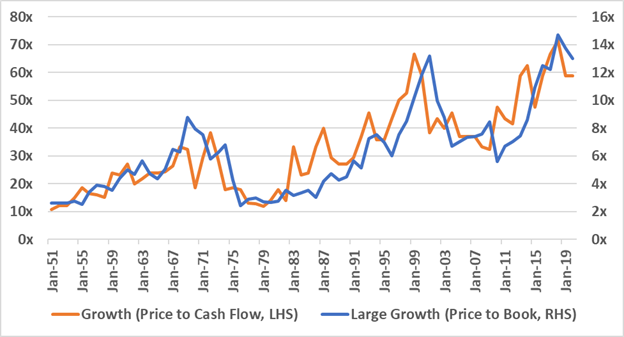
Fundamentally, the large cap growth stocks are too expensive. As you can see from the chart below, they got more expensive than at the tech bubble peak. We can’t forget about the shift in demand that’s coming in 2021 when the economy reopens. Some people will keep working at home and some people will have flexible work schedules where they come into the office a few days per week. However, the demand for work from home products/services is going to fall as people go back to their offices.
The digital transformation was overly priced in. It’s not a good position to be in where growth falls because of tough comps. Plus, these stocks are extremely expensive. Valuations don’t get to be ignored forever. This is a psychological case study as much as it is analytical. The investors who own these software stocks have a lot of profits and fear a turn. They know they are expensive. It makes sense to take profits. The problem is everyone wants to take profits at once causing the stocks to crash.
Conclusion
Monday was a crazy day in market history. It could signal an end to the software trade as the story is no longer intact as less work will get done remotely. The unrealistic theory was that these stocks would be fine when the economy reopened because demand would be above where it was prior to COVID-19. Demand definitely will be above the previous level, but the stocks will still likely fall because they are priced to perfection. It’s basic human psychology to want to take profits once your stocks fall after a big rally. The rise in the long bond was a big deal. The curve is steepening as it always does early in expansions. The question of when the Fed will hike rates again will come up next year if the vaccine and treatments control COVID-19.
Have comments? Join the conversation on Twitter.
Disclaimer: The content on this site is for general informational and entertainment purposes only and should not be construed as financial advice. You agree that any decision you make will be based upon an independent investigation by a certified professional. Please read full disclaimer and privacy policy before reading any of our content.


