UPFINA's Mission: The pursuit of truth in finance and economics to form an unbiased view of current events in order to understand human action, its causes and effects. Read about us and our mission here.
Reading Time: 4 minutes
Headline CPI missed estimates and core CPI beat estimates. We will get into the details of how that happened in this article. First, let’s discuss what that means. If you deflate wage growth by CPI, it means real weekly wage growth improved again. It has been on a good run recently and has been strong this cycle. We’ve seen criticisms claiming CPI is a bad deflator because it’s too low, but actually, some quirks in the way the data is calculated pushed CPI higher this month. CPI is usually above PCE inflation. Because of a quirk, it doesn’t look like core PCE inflation will increase as much as core CPI. Therefore, it’s doubtful the Fed suddenly changes its stance on rate cuts because of core CPI.
The best way to get the Fed to stop cutting would be to have a trade deal. Last week Powell stated, “I think it is the case that uncertainty around trade policy is causing some companies to hold back now on investment. We’ve been hearing quite a bit about uncertainty. So for businesses, to particularly make longer-term investments in plants or equipment or software, they want some certainty that the demand will be there.” To be clear, this isn’t to say the Fed won’t have a modest issue with inflation next year. It might because core PCE will face easy comparisons.
Headline & Core CPI Diverge
Specifically, headline CPI was 1.7% which met estimates and fell from 1.8%. Core CPI was 2.4% which beat estimates and increased from 2.2%. This is the highest core CPI since September 2008. On the other hand, the 2 year stack only increased from 4.54% to 4.57%. The improvement in yearly core CPI was mainly due to an easier comparison. However, even easier comps are coming, so maybe that’s not a reason to doubt core inflation.
Labor Costs Are Driving Inflation
Headline inflation was driven lower by energy prices as energy inflation was -4.4%. Energy inflation will be a drag on headline inflation for the next 2 months if oil prices stay around where they are now. Oil prices peaked in early October 2018. In this August report, fuel oil inflation was -8.4% and gasoline inflation was -7.1%. Food inflation was also partially why headline CPI was below core CPI. Food inflation was 1.7%. Food at home suppressed inflation and food away from home drove it higher. The former was just 0.5% and the latter was 3.2%.
As you can see from the chart below the 5 year compound annual growth rate of food away from home inflation divided by food at home inflation is near the highest it has been in the past 60 years. That’s because of labor costs as the labor market is tight.
Food at home inflation was low because of all its categories. The weakest was meats, poultry, fish, and eggs which had -0.6% inflation.
Inflation was low despite the tight labor market because commodities inflation was low. We already discussed food and energy. Core commodities inflation was only 0.8%. This month, it was brought lower by new vehicles and medical care commodities inflation which were 0.2% and 0.1%. Services less energy is driving inflation higher as it increased from 2.8% to 2.9% in August.
This brings us to the quirk in the data which explains why core CPI rose and why the Fed won’t respond by stopping its plans to cut rates.
The Quirk In The CPI Report
The quirk in the data pertains to medical care services inflation. It rose from 3.3% to 4.3%. This drove core services inflation higher despite the 0.1% decline in shelter inflation to 3.4%. This spike in medical care inflation gave it the highest reading since September 2016. This was one of the highest rates of the cycle. There were a few reasons for this peculiarity. We call it a quirk because there might not have actually been a big change in healthcare services prices.
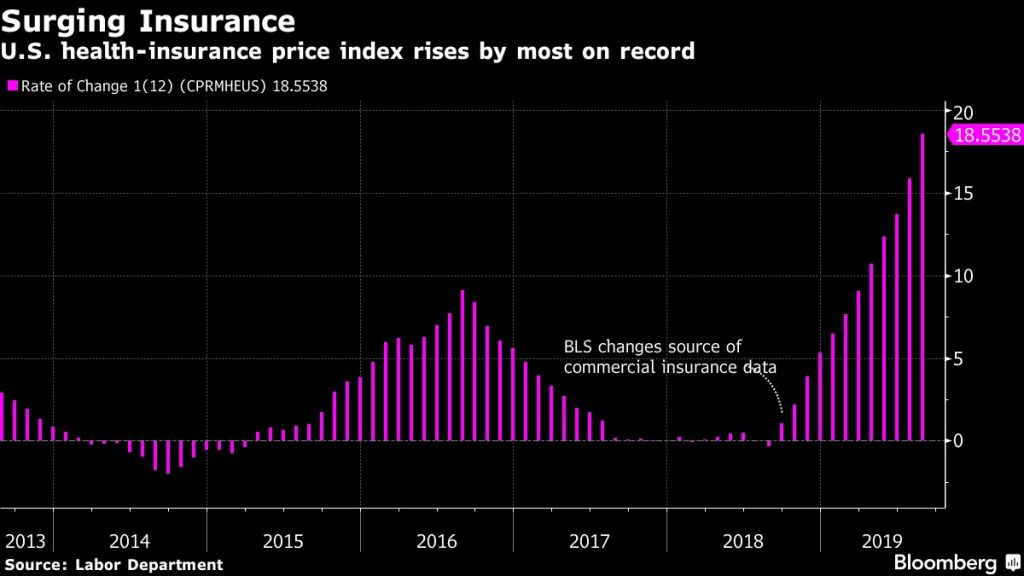
As you can see from the chart below, healthcare insurance inflation was 18.6% which is the highest rate since at least 2005.
There are 3 details to review on why this may have occurred. They are all about data collection and not fundamental changes to pricing.
CPI only measures out of pocket payments. Conceptually, it’s measured similarly to a hedonic adjustment. That is when CPI adjusts inflation based on changes to quality. When measuring health insurance inflation, the BLS tries to measure what consumers pay into insurance versus what they get out of it. That means if consumers pay the same amount into insurance, but receive less benefits, the CPI reading increases. Therefore, a rise in health insurers’ profits relates to higher inflation.
The 2nd quirk is that CPI collects data on health insurance inflation annually and spreads inflation out monthly unlike the other goods and services in the report which are measured monthly. The third quirk is seen in the chart above. The BLS changed its data provider on premiums and benefits in September 2018 which is right before this big run in prices making it somewhat dubious.
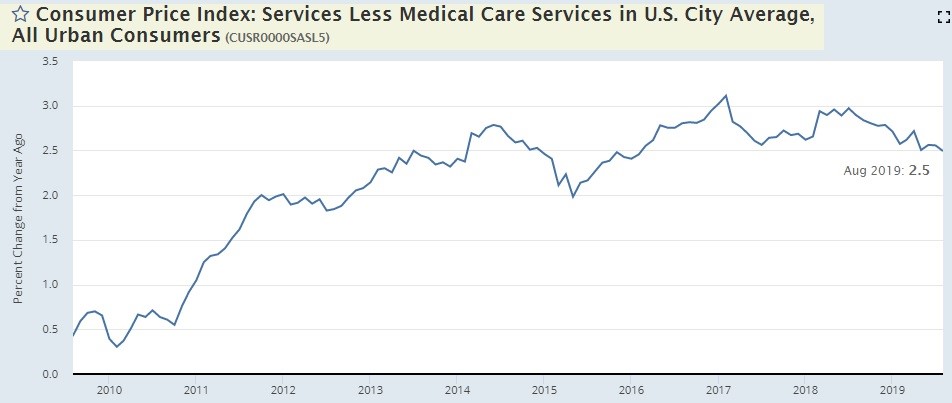
As you can see from the chart below, services inflation without medical care services inflation is falling. It fell from 2.6% to 2.5% in August which is in the middle of its 5 year range which is from 2% to 3.1%.
If you’re a skeptic of medical care inflation, this shows you what it would be without it.
The Fed won’t change policy because of this CPI reading because core PCE inflation is very likely to stay below 2% in August. The PCE inflation report covers health insurance payments made on your behalf. The PCE report uses data from the PPI report which is why the PPI’s selected healthcare industries reading is highly correlated with the PCE’s healthcare services measurement. Without the burst in healthcare services inflation, we don’t see core PCE inflation hitting a cycle high.
Conclusion
Obviously, you can draw your own conclusions on the merit of this CPI report. However, even if you think inflation is a big problem because of this cycle high core CPI reading, the Fed won’t change its tune because core PCE inflation will be below 2%. That report is after the Wednesday Fed meeting anyway. The best way to get the Fed to stop cutting rates is for there to be a trade deal.
Have comments? Join the conversation on Twitter.
Disclaimer: The content on this site is for general informational and entertainment purposes only and should not be construed as financial advice. You agree that any decision you make will be based upon an independent investigation by a certified professional. Please read full disclaimer and privacy policy before reading any of our content.


