UPFINA's Mission: The pursuit of truth in finance and economics to form an unbiased view of current events in order to understand human action, its causes and effects. Read about us and our mission here.
Reading Time: 5 minutes
Don’t say stocks are being pushed down by treasuries. That’s a mistaken assertion based on the rally in stocks and the decline in yields both in the past few decades and the past 3 months. Stocks aren’t being pushed down by treasuries; instead stocks are falling along with yields because they are affected by the same thing, namely declining growth estimates. Specifically, the 10 year yield has fallen to just 2.39% which is down 85 basis points from its closing peak of 3.24% in November.
10 Year Yield Implied Economic Growth Rate
The chart below is a wonderful representation of the growth rate the 10 year yield implies.
Briefly in November when yields were peaking, there was an expectation for almost 4% GDP growth in the next year. That was an amazing time to go long bonds because the economy was already showing signs of slowing. There are occasionally easy trades where you can profit off already reported information. Sometimes assets become wildly mispriced in the short run. Don’t overthink the trade, just act on it in these rare situations. At that point when yields peaked, the blue chip consensus was only expecting slightly above 2% growth.
Now we are in the opposite situation as the 10 year bond yield is projecting 1.4% GDP growth in the next year which is below the blue chip estimate for about 2% growth. The 2 main reasons it isn’t an easy trade to short the 10 year bond are that the difference from blue chip expectations isn’t as large and there aren’t reports showing the economy is exiting this slowdown. That’s not to say you shouldn’t short treasuries. It’s just not a high probability trade and the potential for gains isn’t as large as going long them at the peak in yields last year.
Percentage Inverted
With some of the yield curve inverting, there are debates among investors over which parts of the curve to follow. We think it’s best to follow every part by looking at the percentage of the curve that has inverted. As you can see from the chart below, only about 30% of the curve has inverted which doesn’t meet the peaks prior to the past 4 recessions.
Each of the last 3 peaks has been lower than the previous one. If that trend continues, the percentage still needs to increase from here to forecast a recession. 18 months following the yield curve inversion in the past 5 cycles, on average real EPS growth was -9.3%. It was -0.2% after 12 months and 2.5% after 6 months. This explains why stocks don’t immediately fall after inversions.
What The Middle Of The Curve Shows
The chart below shows the spread between the 30 year yield and the 5 year yield has increased while the difference between the 5 year yield and the 2 year yield has inverted.

The middle of the curve as represented by the 5 year yield, has garnered intense investor demand, pushing it to a 14 month low. The 5 year yield has fallen because investors see rate cuts coming in the intermediate term. The 2 year yield has also fallen as it is at 2.24% which is 16 basis points below the Fed funds rate. Demand for nearer term maturities like the 6 month yield will increase once investors see rate cuts as inevitable. As for now, demand is light since it is 3 basis points higher than the Fed funds rate. The CME Group Fed Watch tool shows there is only an 8% chance of a rate cut at the May 1st meeting, but there is a 70.7% chance of a cut by the end of the year.
GDP Doesn’t Predict Recessions
The initial GDP report is a summary of economic output subject to revisions. Some say the revisions make it worthless because by the time the revisions are released, the quarter is far in the past. Whether you follow GDP or not, it’s safe to say it’s not a good arbiter of whether a recession is coming or even if it is underway.
As you can see from the chart below, the GDP growth initially reported prior to the last two recessions didn’t indicate a recession was coming.
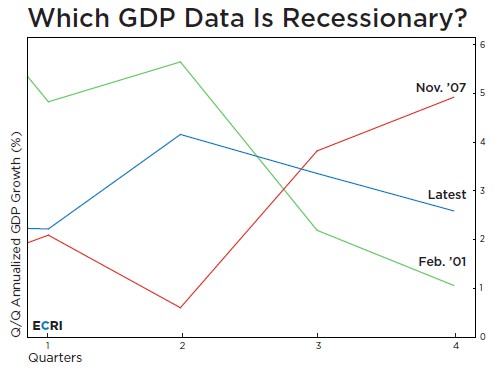
Remarkably, real time data in November 2007 showed GDP growth of 4.9%. Revisions cut that growth rate more than in half, but that was after we knew the economy was in a recession. The initial Q4 2018 growth rate was in between the rates before the past 2 recessions. It has since been revised lower from 2.6% to 2.2%. These results don’t mean a recession is about to happen, but also don’t mean a recession won’t happen. Currently, ECRI isn’t forecasting a recession this year; its leading index’s growth rate has improved, but is still negative.
Housing Applications Improve & Price Growth Falls
The MBA Applications data from the week of March 22nd was strong as the purchase index was up 6% weekly, which was on top of 0.3% growth, and 4% yearly. Low interest rates are starting to give the housing market momentum. In the week of March 28th (not yet calculated by MBA) 30 year fixed rates fell the most in over 10 years from 4.28% to 4.06%.
On the other hand, the CoreLogic Case-Shiller 20 city Home Price Index showed yearly, non-seasonally adjusted price growth in January fell from 4.1% to 3.6%. The weakest cities were in California as yearly growth was only 1.3% and 1.7% in San Diego and San Francisco. Weakness in the tech sector could be impacting San Francisco. Growth in Seattle, which was once one of the hottest housing markets in 2018, has fallen precipitously. Yearly price growth recently peaked at 13.6% in May 2018; now it is only 4.1%.
If you needed a reminder the housing market isn’t in a bubble that is bursting, the chart below shows the MBA credit availability index. It shows credit is still tight 10 years into this expansion.
Borrowers are the most qualified in this cycle than any other one throughout history. Prices can fall, but there won’t be a surge in defaults like in 2008.
Conclusion
Parts of the yield curve have inverted, but most of it is still normal which means the chance of a recession in the next 18 months isn’t high. Investors are beginning to project rate cuts, but the Fed funds futures market has a terrible track record of predicting intermediate term rates. In the short run, there is very little chance of a hike. The MBA purchase applications growth rate spiked in the first week of spring. We need to see a few more weeks of strength before we call this a trend. Price growth was weak in January which means housing is on its way to becoming more affordable.
Have comments? Join the conversation on Twitter.
Disclaimer: The content on this site is for general informational and entertainment purposes only and should not be construed as financial advice. You agree that any decision you make will be based upon an independent investigation by a certified professional. Please read full disclaimer and privacy policy before reading any of our content.


