UPFINA's Mission: The pursuit of truth in finance and economics to form an unbiased view of current events in order to understand human action, its causes and effects. Read about us and our mission here.
Reading Time: 5 minutes
In this article, we’re going to look at the three main causes of the stock market correction that occurred in March which came close to matching the lows set in February. When you understand the reasons the market fell, it helps you figure out where stocks will likely go for the rest of the year. Obviously, new headlines always pop up, but it’s good to understand the basics of why markets moved in the past before making future projections. The three main stories which tell us why stocks fell in March are a weakening economy, which should be temporary, a more hawkish Fed, and the rumors of a trade war with China. We’ll delve into those reasons in this article.
Weak GDP Growth Is Probable In Q1 Despite Fiscal Easiness
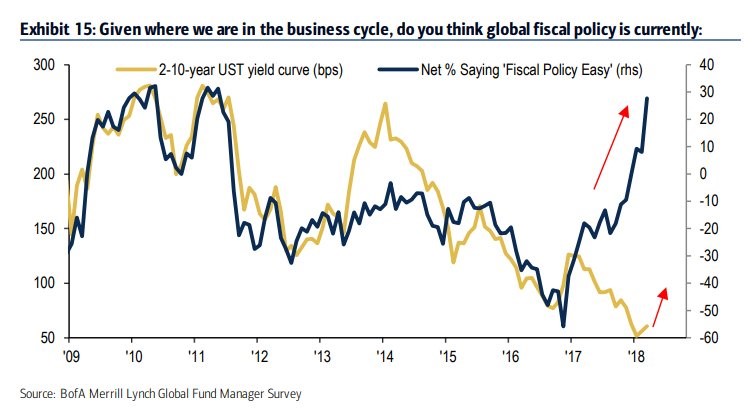
The Fed recently increased its target for GDP growth in 2018 from 2.5% to 2.7%. Many other forecasts are above 2.5%. For example, Bank of America expects 2.9% growth. The optimism stems mainly from the tax cuts, the momentum shown in the 2nd half of 2017, and the recent $1.3 trillion spending bill which increases military spending by $80 billion, which is the biggest increase in 15 years, and adds $10 billion in infrastructure spending. This spending on programs isn’t that large, but the fact that the government is projected to run increasing deficits at a time when the labor market is nearing full employment shows how easy fiscal policy has become.
The chart below shows the net percentage of fund managers who claim fiscal policy is easy is the highest since 2010 and 2011.
Even with the improvement to fiscal policy, the Atlanta Fed GDP Now expects 1.8% growth in Q1 and the blue chip index is at 2%. Weak retail sales, auto sales, and housing have combined to push down the estimates for Q1 GDP. The manufacturing sector has been solid as the latest durable goods report from February showed an 8.9% year over year growth rate in new orders and an 8% growth rate in core capital goods. Manufacturing is a small part of the economy, so it’s not enough to boost the overall result. Durable goods orders only contributed 7.6% to GDP in 2017.
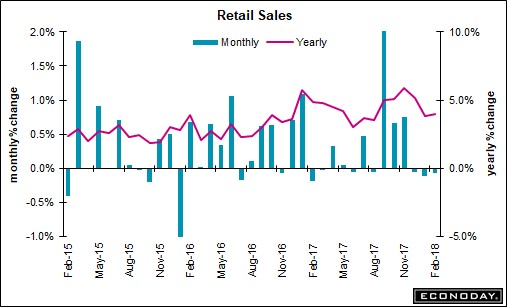
As you can see from the chart below, the month over month change in retail sales growth has been negative for 3 months.
That’s not that bad of a result in general, but it’s a big miss to expectations which are high because of the tax cut and the high job creation (313,000 jobs added in February). The February report showed -0.1% growth which missed estimates for 0.4% growth. Vehicle sales have been coming down from the spike after the hurricanes. This overall weakness is disconcerting since the University of Michigan consumer sentiment reading was 99.7 in February which was the 2nd highest reading of this cycle.
The Fed Is Getting Hawkish
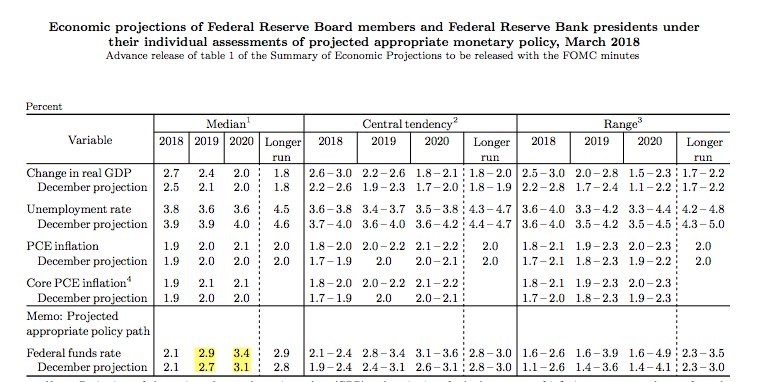
Despite the weak retail sales results, the Fed is getting more hawkish. The table below shows the changes to the Fed’s guidance after chairman Powell’s first FOMC meeting in March.
The Fed funds rate estimate for 2019 has increased from 2.7% to 2.9% and the estimate for 2020 was increased from 3.1% to 3.4%. It’s also worth noting that the Fed was 1 vote away from moving the forecast from 3 hikes in 2018 to 4 hikes. The more hikes get priced into the market, the tighter financial conditions could get. They certainly tightened after this correction, but ignore the noise of short term vacillations in sentiment and focus on the medium term trend which is the Fed taking away the punch bowl. Currently, the odds for at least 4 hikes are at 31.6%, so there will be a market reaction to 4 hikes because they aren’t fully priced in.
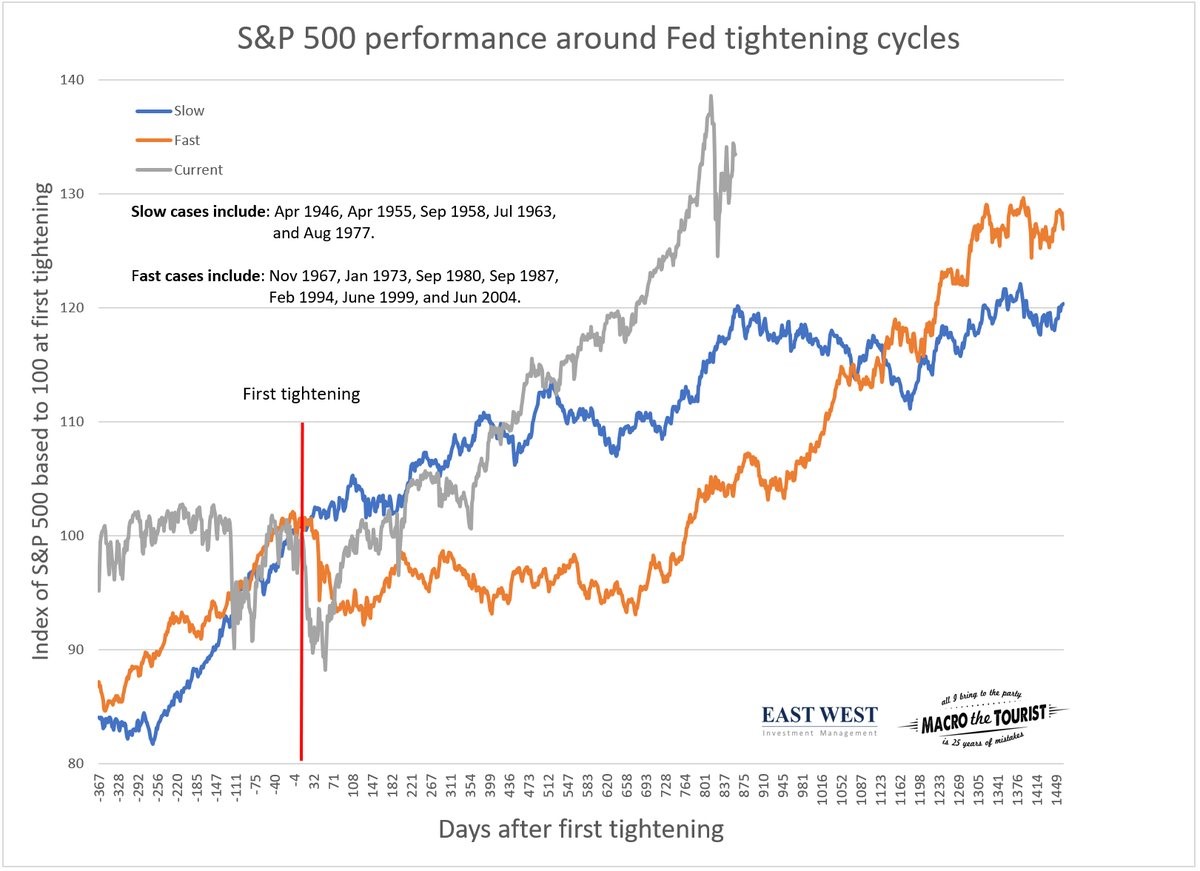
The chart below shows the S&P 500’s performance during rate hike cycles. Note: This chart isn’t updated to show the correction in stocks in March.
Rate hikes signal the economy is strong which is why stocks do well during them. Only after rate hikes stop occurring do stocks fall. The current bull market has been stronger than average as you can see by the grey line. The orange line shows when the Fed hiked rates quickly and the blue line shows when rates were hiked slowly. The current situation is the first slow hike cycle since 1977. If the Fed slows hiking due to lower inflation or growth expectations, the market performance will likely follow the blue line of historically slower rate hikes, with the S&P 500 being weaker in the upcoming year or two.
The Tariff Risk Is Unknown
The market hates uncertainty. That’s the exact situation it is in with the potential trade war between America and China. Trump has issued a tariff on $60 billion worth of Chinese goods including aeronautics, modern rail, new energy vehicles, and high tech products. He has stated there will be more tariffs. The administrations goal is to decrease the $500 billion trade deficit with China and to get China to stop allegedly “stealing American firms’ intellectual property“. China responded by issuing a small $3 billion tariff on U.S. goods including wine, fruit, and steel pipes. The market doesn’t know what to make of the cross fire of rhetoric coming from both US and Chinese leaders. It doesn’t make sense to enter a trade war, but obviously it’s a possibility that the market doesn’t like.
Conclusion
While weak economic reports, a hawkish Fed, and rumors of a trade war caused stocks to correct in March it is expected that the economy will improve later in the year and earnings growth is still supposed to be 18%. As long as a trade war doesn’t break out, a recession and bear market (more than a 20% correction) are both unlikely in the upcoming year despite the recent 10% drawdown in stocks.
Have comments? Join the conversation on Twitter.
Disclaimer: The content on this site is for general informational and entertainment purposes only and should not be construed as financial advice. You agree that any decision you make will be based upon an independent investigation by a certified professional. Please read full disclaimer and privacy policy before reading any of our content.


