UPFINA's Mission: The pursuit of truth in finance and economics to form an unbiased view of current events in order to understand human action, its causes and effects. Read about us and our mission here.
Reading Time: 5 minutes
In this expansion, past economic performance doesn’t indicate future trends. We’ve had 3 slowdowns in this expansion. At the worst point in the prior 2 slowdowns, it looked like the economy was headed for a recession, but it was actually a great time to buy stocks. The stock market decline in Q4 2018 was way ahead of the potential future recovery as the slowdown hadn’t fully played out. However, the point remains that when things looked bad, it was a buying opportunity. It’s not always a good time to buy stocks when the economy weakens. It’s simply a good time to do so if the economy doesn’t fall into a recession.
The charts below support the thesis that the 3 rate cuts in 2019 will help the economy and earnings recover in 2020.
Earnings certainly need to recover because S&P 500 EPS growth is expected to be 9.6%. EPS estimates usually fall as results get closer to coming out, but if they fall more than average, it’s bearish for stocks. Companies need to grow into their valuations because as of January 3rd, the S&P 500’s forward PE multiple was 18.3. That’s higher than the 5 year average which is 16.7.
As you can see, lower rates lead to housing improving and the money supply rising 9 months later. In this case, lower rates are long term rates since mortgages are usually 15 or 30 years long. We’ve shown in previous articles that the housing market has turned a corner due to the decline in rates and the oversupply clearing out. Solid wage growth and lower home price growth help too.
The charts show money supply growth and the national association of homebuilders index turning up. They lead the ISM new orders index by 9 months. 5 months after that, the ISM new orders index minus the inventories index starts to rise. You can see it inching up in the 3rd chart. That’s advanced 4 months ahead of the ISM manufacturing index. PMIs and EPS increase 4 months after the ISM new orders minus inventories index increases and 18 months after rates fall. This means either Q1 or Q2 EPS growth should show acceleration.
Q4 Earnings Estimates Have Cratered
The Earnings Scout shows every quarter in 2019 had positive non-GAAP EPS growth, albeit just barely. On the other hand, FactSet shows Q1 EPS growth was -0.3%. Q2 and Q3 growth were -0.4% and -2.2%. Q4 growth is expected to be -1.5% which means if estimates are beaten like they usually are, EPS growth will be positive for the first time in 2019. As you can see from the chart below, EPS estimates decline right before results come out and then rise as estimates are beaten. EPS growth will be about 0.5%.
Growth will still be weak, so don’t think that a turnaround has occurred just because it’s now positive. Q4 comps are 12.8% easier, so the 2 year growth stack is almost certainly going to fall. Q4 has been terrible for earnings estimates which makes the recent rally in stocks all the more shocking. Investors are ignoring the weak economy and poor earnings growth in 2H 2019 because they see a recovery in 2020 as indicated by the set of three charts earlier in this article.
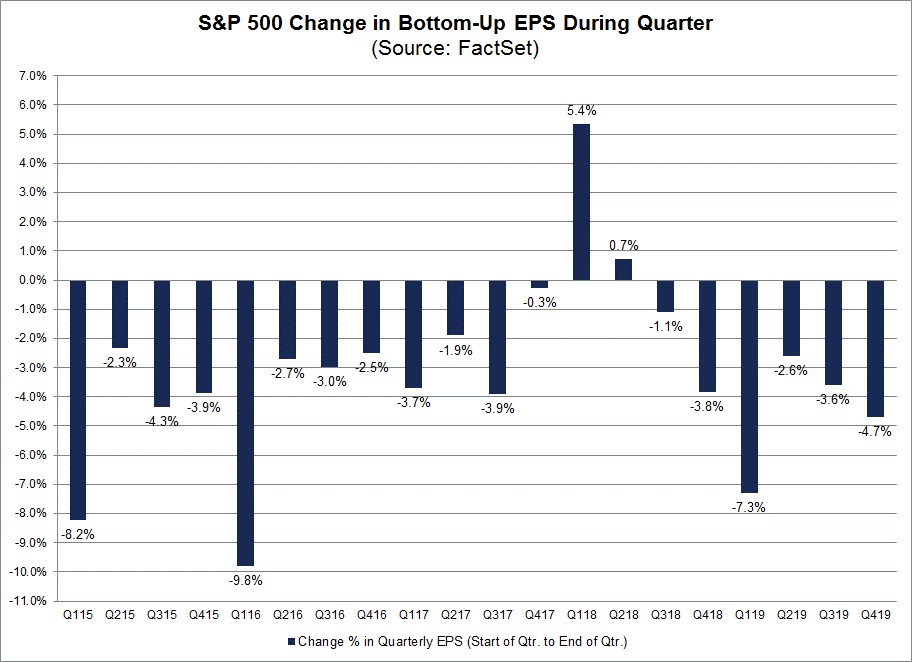
As you can see from the chart below, Q4 EPS estimates fell 4.7%. That’s the largest decline since Q1 where EPS estimates fell 7.3%.

Q1 2019’s decline was the largest since Q1 2016 which was towards the end of the last earnings recession. It’s debatable if the weakness in 2019 constitutes a true EPS recession because non-GAAP EPS growth didn’t fall according to The Earnings Scout and it only fell marginally according to FactSet. What’s not debatable is the relative weakness of the decline in Q4 estimates. It’s worse than the 5, 10, and 15 year averages. Those average declines are 3.3%, 3.1%, and 4.4%. EPS estimates usually fall, but not by that much. This decline has been led by consumer discretionary (down 15%), energy (down 13.3%), materials (down 11.5%), and industrials (down 10.4%).
Strong December ADP Private Sector Payrolls
The ADP private sector payrolls report showed 202,000 jobs were added which was above estimates for 157,000 and the highest estimate which was 180,000. Furthermore, this is higher than the consensus for private sector job creation in the BLS report which is 150,000. This was the best ADP report since April. November’s reading was revised from 67,000 to 124,000, but it’s still well below the BLS report which showed private sector 254,000 jobs were added. That number was boosted by the ending of the GM strike.
Small business job creation has been a problem area in the last few ADP reports, particularly very small firms (1-19 employees). In 4 of the previous 7 reports, there had been negative job creation by very small firms. In the December report, 9,000 jobs were added which was up from near 0 and the highest since August. Overall small business job creation was up from 36,000 to 69,000 and was the highest since January 2019. That was spurred by other small firms which added 60,000 jobs which was the highest since December 2015. 19,000 small firm jobs created were in the goods producing sector and 50,000 were in the services sector.
Large businesses created 45,000 jobs and mid-sized firms added 88,000 jobs. Goods providing firms created 29,000. Manufacturing lost 7,000 and construction added 37,000. The yearly change in the number of construction jobs was up for the 2nd straight month which was the first such streak since July 2018. It was helped by the housing market’s recovery. The service sector added 173,000 jobs. Leisure and hospitality lost 21,000 jobs and information lost 14,000 jobs. In other words, very low and very high paying jobs were lost.
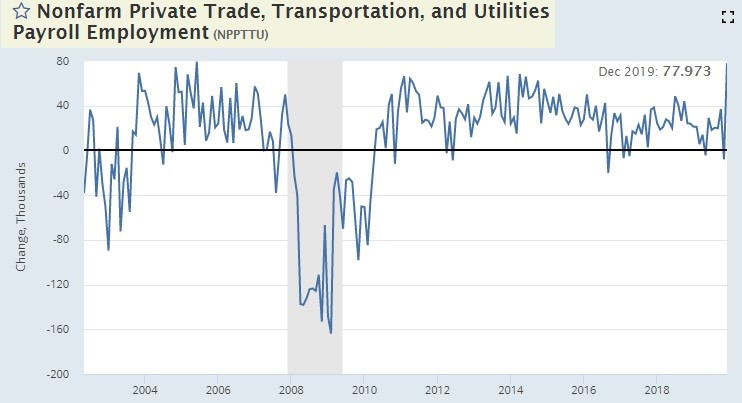
The report shows a cyclical expansion is afoot since healthcare and education added 49,000 jobs which was only the 3rd most. The top two were professional and business which created 61,000 jobs and trade, transportation, and utilities which created 78,000 jobs. As you can see from the chart above, the latter industry created the 2nd most jobs ever (since May 2002). The most was 79,000 in June 2005. Professional and business job creation was the most since April.
Conclusion
The economy might be starting to turnaround. If that’s the case, 2020 EPS estimates won’t fall as much as usual. The rally in 2019 will be justified. That being said, stocks are still expensive, so don’t expect more multiple expansion. The December ADP report was strong. Let’s see if it leads to a strong BLS report.
Have comments? Join the conversation on Twitter.
Disclaimer: The content on this site is for general informational and entertainment purposes only and should not be construed as financial advice. You agree that any decision you make will be based upon an independent investigation by a certified professional. Please read full disclaimer and privacy policy before reading any of our content.


