UPFINA's Mission: The pursuit of truth in finance and economics to form an unbiased view of current events in order to understand human action, its causes and effects. Read about us and our mission here.
Reading Time: 6 minutes
We have reviewed the impact demographics could have on the housing market and how millennials are delaying homeownership in many different articles. Even though bullish investors are hoping for a big spike in demand for housing, millennials aren’t delivering on their potential yet. The most popular age in America is 27. As you can see from the chart below, the median age of homeowners has increased from 50 in 2002 to 56 in 2015. In that time, the median age of adults in America increased from 43 to 47. The age of renters only increased from 38 to 40. Therefore, most of the reason for this increase is because millennials aren’t buying houses at a young age.
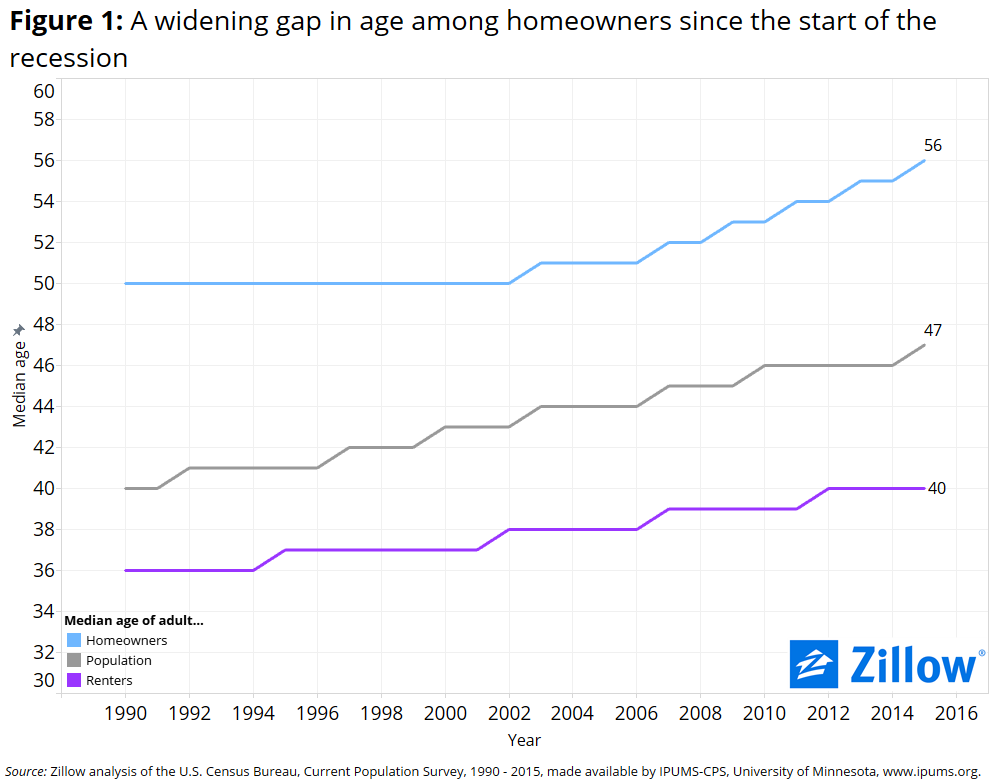
Source: Zillow
Millennials are having a tough time buying houses because of student debt and housing being unaffordable in most areas besides the Midwest. If prices fall, more millennials will buy houses, but that demand will push up prices again. The rising rates in the past year certainly don’t help. The chart below shows the historical changes in housing starts.
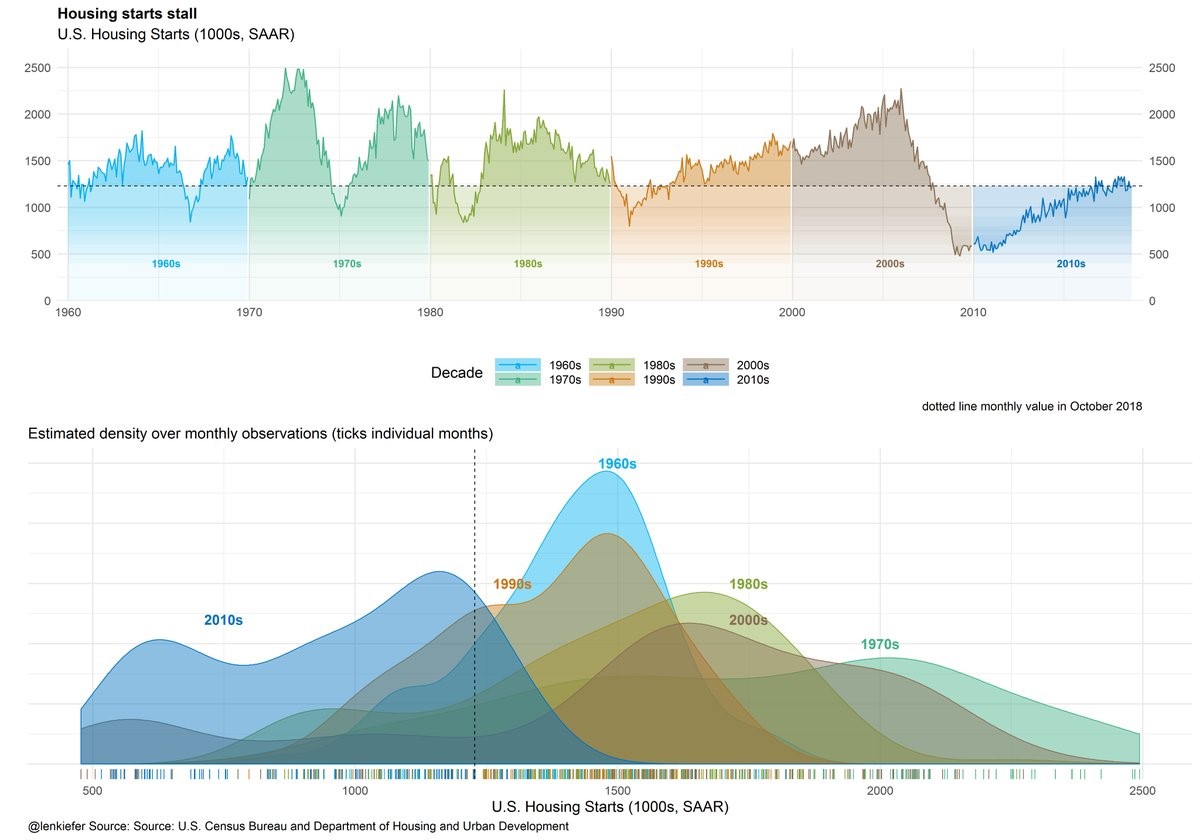
Source: Leonard Kiefer
It’s interesting because this cycle looks more like a recession than an expansion. It’s possible that the expansion extends for a few more quarters and housing starts increase further. If this is the end of the cycle, there was a dearth of housing starts. There haven’t been enough starter homes built to help millennials become homeowners. Sometimes it doesn’t make sense to buy a starter home if you’re only planning to live in it for a few years because of all the costs associated with buying and selling a home. Either way the lack of options isn’t allowing many millennials to buy their first home.
Housing Starts & MBA Applications
We will review the latest housing starts & MBA applications reports because housing has been one of the first indicators which has warned about a possible recession. October housing starts missed estimates, coming in at 1.228 million while expectations were for 1.24 million. They grew 1.5% month over month and fell 2.9% year over year. Multi-family starts were up 10.3% to a 363,000 rate which is great because there is a dearth of affordable apartments in many cities because of zoning laws. Single family housing starts were down 1.8%. They rose 4.7% in the south, were strong in the Midwest, and fell in the west and northeast.
Permits were 1.263 million which beat estimates for 1.26 million. They fell 0.6% monthly and 6% yearly. Single and multi-family permits fell 0.6% and 0.5% monthly. The west was a disaster as permits fell 7.9% monthly and 17.9% yearly. For the whole country, completions fell 3.3% monthly and 6.5% yearly as there is weakness throughout the process of building and selling homes. Single family and multi-family completions fell 1.2% and 9.1% monthly.
The MBA mortgage index is from November like the housing market index which was very weak. The week of November 16th saw the composite index fall 0.1% as the purchase index increased 3% and the refinance index fell 5% weekly. Unadjusted purchase applications fell 5% yearly. Refinance’s share of mortgage’s fell 0.9% to 38.5% which is the lowest level in 18 years. Many homeowners refinanced when interest rates hit record lows earlier this cycle. 30 year fixed rates fell 1 basis point to 5.16%; this was the first decline in 7 weeks.
Which Is The Best Leading Index?
Jobless claims have a great record of indicating recessions and bear markets. It’s important to realize you can’t wait too long for this indicator to confirm weakness because it moves in concert with stocks since both are leading indicators. That means you need to be focused on the report which can sometimes have significant variance because of one-time events. If the weakness isn’t caused by a one-time event, it’s a negative sign for the labor market and stocks. That is the case with the latest report.
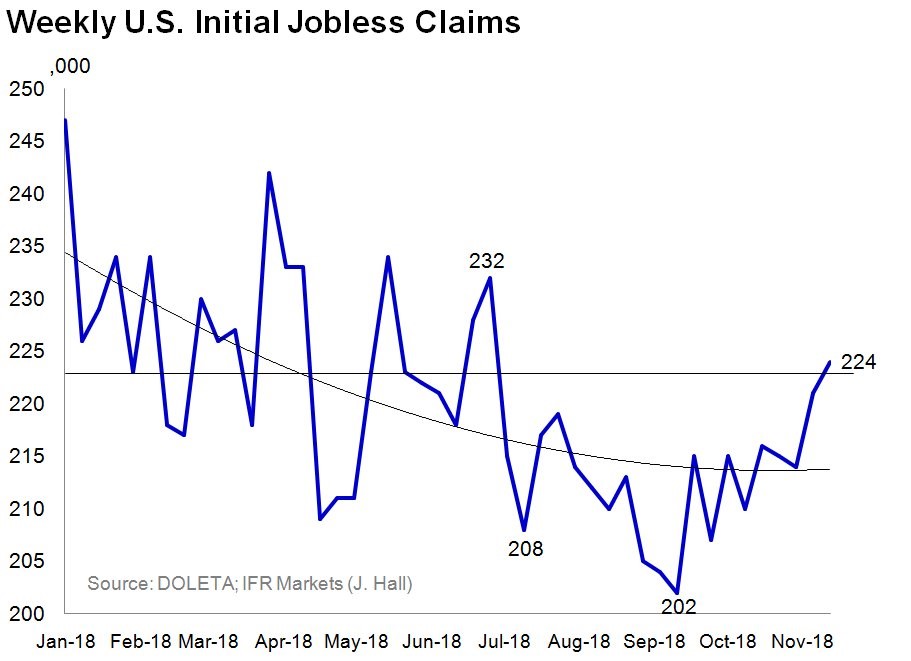
Source: IFR Markets
As the chart above shows, the prior report was revised from 216,000 to 221,000 and the latest report saw jobless claims increase to 224,000 which was higher than estimates for 215,000. The 4 week average increased from 216,500 to 218,500. This was the first back to back increase in claims in 16 weeks. The 4 week average hit its highest level in 18 weeks.
The October leading indicators hit a new record high as the index was up 0.1% month over month. The stock market and jobless claims are included in that index. The overall index differs from their results because this report is from October, which means it doesn’t include their latest weakness, and because the leading credit index, interest rate spread, and consumer expectations for business conditions improved.
The ECRI leading index from November 16th is down 3.7% which is disconcerting. It has been early in predicting this slowdown and is a more updated reading than the leading indicators.

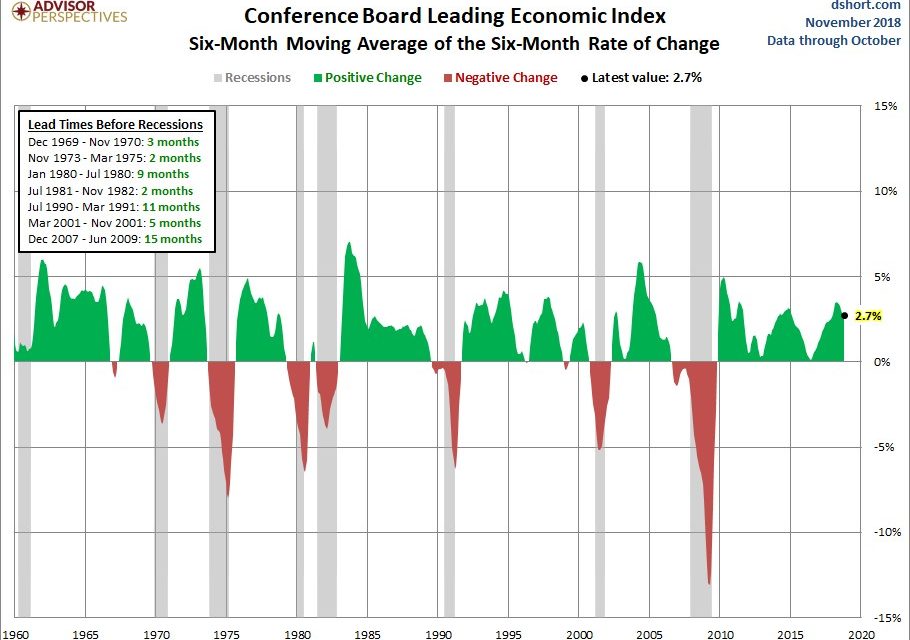
Source: Advisor Perspectives
The chart above shows the 6 month moving average of the 6 month rate of change in the leading indicators. It was up 2.7%. It has led recessions by 6.7 months on average in the past 7 cycles. There were two false alarms since the 1960s. By the time this indicator turns negative, it might be too late to sell stocks.
2019 Economic Picture
The leading indicators don’t suggest a recession is coming in the next few months, but there are a few negative catalysts in 2019 which will slow growth. They could push the leading indicators lower. The tariff rate of 25% on Chinese goods will start in 2019. The chart below shows financial conditions will be a drag on GDP growth in 2019 and the fiscal stimulus will provide less of a benefit as the year goes on.
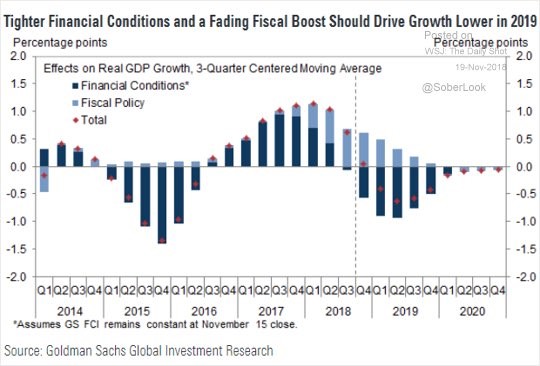
Source: Goldman Sachs
Financial conditions being stressed means it will be tougher for firms to borrow. As you can see from the chart below, the high yield spread is the highest since December 2016.

Source: Merrill Lynch
This spike will be a catalyst for further weakness in the leading indicators. It will make it tough for small caps with high debt to survive. We aren’t near a problematic level yet, but if the spread increases further, firms will need to layoff workers which will spike jobless claims further.
As we mentioned, many firms, especially small caps, will have a tough time paying back loans when interest rates increase. As you can see from the chart below, the percentage of firms where interest payments exceed operating profits is high which means the economy is leveraged. If these zombie firms go bust, the slowdown will get worse.
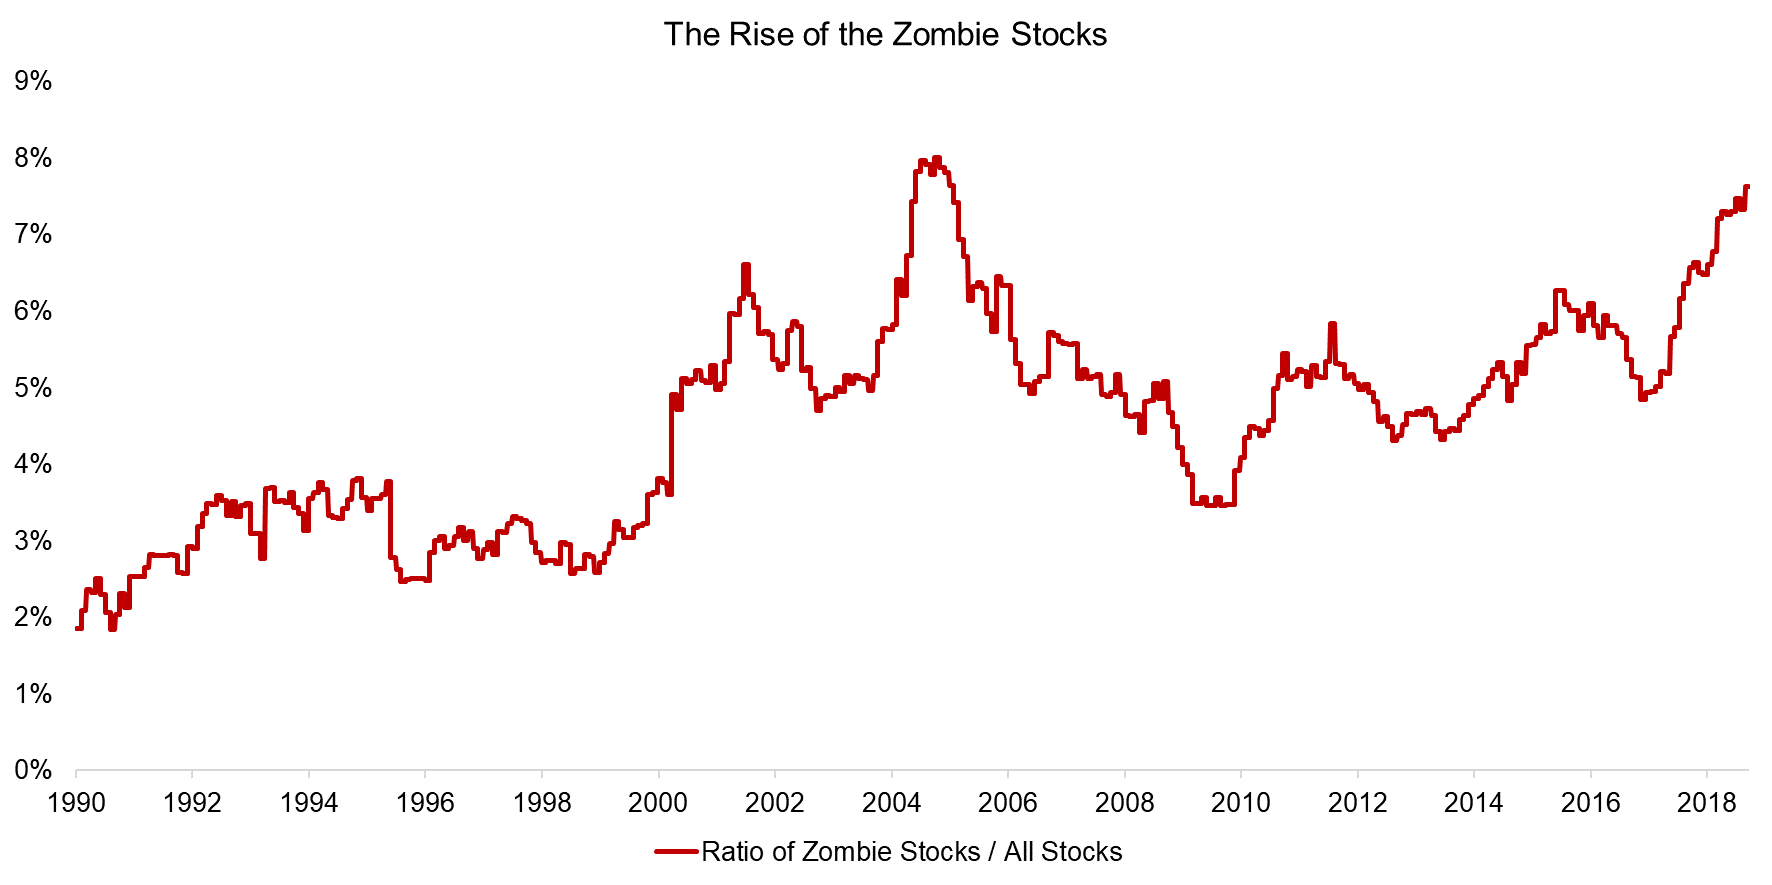
Source: Factor Research
Conclusion
The housing market leads the economy by the longest which means it is usually the first industry to show weakness. The ECRI leading index is also predicting a slowdown. Because the leading indicators are still positive, a recession is unlikely in the next 6 months. When high yield spreads spike further, many zombie companies will go bust which will hurt the labor market.
Have comments? Join the conversation on Twitter.
Disclaimer: The content on this site is for general informational and entertainment purposes only and should not be construed as financial advice. You agree that any decision you make will be based upon an independent investigation by a certified professional. Please read full disclaimer and privacy policy before reading any of our content.


