UPFINA's Mission: The pursuit of truth in finance and economics to form an unbiased view of current events in order to understand human action, its causes and effects. Read about us and our mission here.
Reading Time: 4 minutes
On Monday, the stock market soared to a new 2019 high as the S&P 500 increased 1.16%. It was said that the stock market increased because of good economic data from America and China. The American data was amazing if you ignore the bad reports that came out. Obviously, you can’t do that; the results were actually mixed. Remember, the headlines are heavily influenced by the tape.
If stocks fell on Monday, it would have been because of weak data, even if the data was the same. That’s why you must ignore short term market performance when reviewing economic reports. The stock market may have increased because it was the first day of the month and the quarter. Since 2003, the S&P 500 has increased 75.6% on the first day of the month. It is said automatic investments cause this great performance. You could set your automatic purchases to the last day of the month to make this extra money.
Retail Sales Miss Expectations
One of the weak reports on Monday was February’s retail sales report. On a monthly basis, each measurement missed estimates and declined, but that’s partially because January’s monthly growth was very solid and it was revised even higher. Specifically, overall retail sales growth in January increased from 0.2% to 0.7%, while February’s growth was -0.2% instead of 0.3%. Interestingly, even though auto sales have been weak, they increased 0.7% monthly. That means growth excluding autos was even worse. In January, it was 1.4%, which was a revision from 0.9%. February was -0.4% which missed estimates by 0.8%. E-commerce sales were up 0.9%. As you can see in the chart below, ecommerce’s share of retail sales has surpassed that of general merchandise. Restaurants had their first gain since October as sales were up 0.1%.
The control group had similar results to the overall numbers as January had growth of 1.7% instead of 1.1% and February had growth of -0.2% which missed estimates by 0.5%. Keep in mind, January’s results weren’t amazing on a yearly basis. They were lapping the terrible December reading on a monthly basis. We need to smooth out this data and look at it on a yearly basis to explain the results clearer. On a yearly basis, retail sales growth excluding food services was 2.1% in February which was worse than January’s 2.6% growth, but better than December’s 1.2% growth. This wasn’t a good report at all especially considering the strong wage growth.
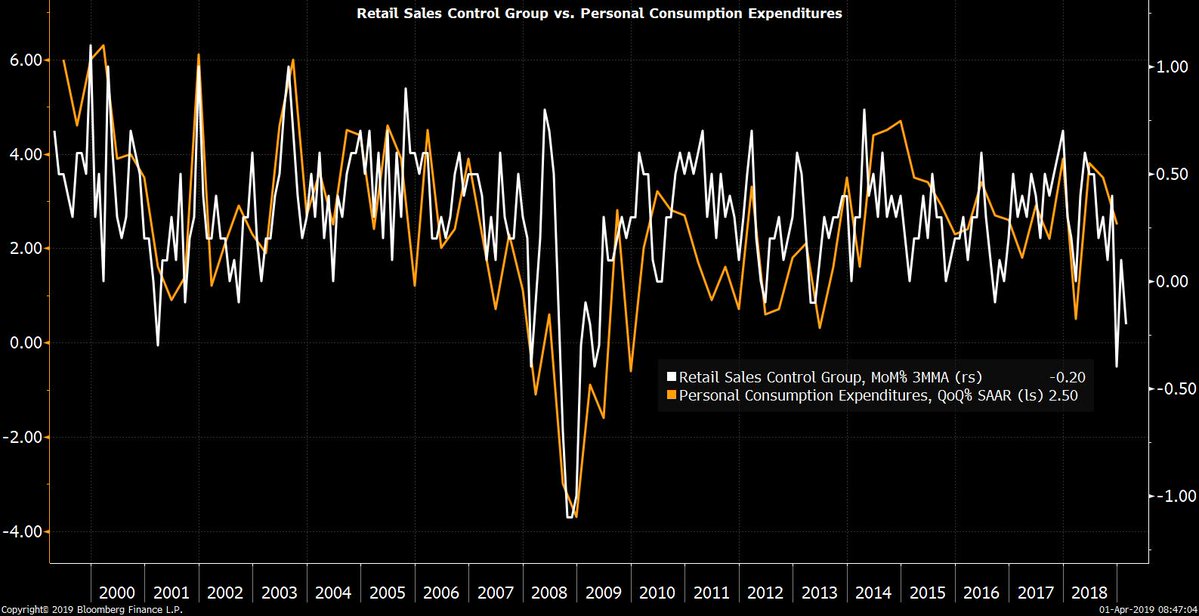
The chart below compares the 3 month average monthly growth in the control group with personal consumption expenditures quarter over quarter growth. This report implies PCE will be weak in February and consumption growth will be weak in Q1.
ISM & Markit Differ on March Manufacturing
The Markit manufacturing PMI fell and the ISM manufacturing PMI rose. This difference isn’t new as the chart below shows the ISM new orders index was significantly above the Markit new orders index in 2017 and 2018.
Let’s first look at the Markit reading. The PMI fell from 53 to 52.4 in March which was the weakest reading since June 2017. The chart shows the correlation between the Markit new orders index and factory orders is a strong 0.76 which implies manufacturing will be a drag on GDP growth in Q1. Specifically, Markit’s commentary stated this survey is consistent with production falling at a quarterly rate of 0.6%. New order growth is close to the 2016 lows. The ratio of new orders to existing inventory fell to the lowest level since June 2017. This implies April might be weak as well.
The ISM PMI wasn’t amazing, but it was solid as it increased 1.1 to 55.3 which is consistent with 3.7% GDP growth. That GDP growth rate is highly unlikely to be reached as the median of estimates is at 1.5%. The PMI was below the 12 month average of 57.7. Unlike the Markit report, the ISM new orders index was up from 55.5 to 57.4. Inflation slowed in the Markit report, but this index was up from 49.4 to 54.3 in the ISM report.
As you can see from the chart below, the share of ISM components improving over the last 6 months has been above 50% since 2010. That’s the longest steak in history as even the 1990s expansion couldn’t top that.
According to the quotes from the ISM report, the trade war is still a prime concern of manufacturing firms. A wood products firm stated “Internationally, the Chinese trade war is still holding business back, but expectations are that in April or May, business will spring back materially as tariffs resolve.”
Chinese PMI Unexpectedly Improves
China had rare good news from the Markit report as its manufacturing PMI was 50.8 which beat estimates for 49.9. As the chart below shows, this was the first reading above 50 in 4 months.
Manufacturing employment increased for the first time in over 5 years. The 1 year business outlook increased to a 10 month high. The Markit comments stated the relaxed financial conditions, progress on the trade discussions with America, and the government’s stimulus helped Chinese manufacturing.
Cycle Peak Coming?
Morgan Stanley’s cyclical indicator for the US suggests the expansion phase might quickly turn into a downturn phase. The probability of a downturn is the highest since 2005. We’re showing this calculation because the inputs are at the bottom. It’s easy to pick apart where this indicator could be going wrong. For example, the unemployment rate isn’t as good as the prime labor participation rate at measuring the labor market. It’s better to look at the percentage of the curve that’s inverted than the 2s 10s curve. We still will be following the ECRI leading index’s yearly growth rate the closest, but this calculation is still edifying.
Conclusion
We didn’t review all the data from Monday, but we showed enough evidence to support the point that not all the reports were amazing. Ignoring the short term gains because it was the first day of the month, it will be difficult for stocks to rally in the intermediate term unless consumption growth improves in Q2. The good news is jobless claims are low and real wage growth is solid. Investors buying stocks must believe in the University of Michigan’s strong confidence reading. Morgan Stanley’s cycle calculation tells us what the ECRI leading index told us about 3 months ago, namely the U.S. economy is in a slowdown. The slowdown should be the most troublesome in Q2 and Q3 if ECRI is correct.
Have comments? Join the conversation on Twitter.
Disclaimer: The content on this site is for general informational and entertainment purposes only and should not be construed as financial advice. You agree that any decision you make will be based upon an independent investigation by a certified professional. Please read full disclaimer and privacy policy before reading any of our content.


