UPFINA's Mission: The pursuit of truth in finance and economics to form an unbiased view of current events in order to understand human action, its causes and effects. Read about us and our mission here.
Reading Time: 5 minutes
It’s very clear by virtually all the data on the housing market that it was very weak in the last 2 months of 2018. Housing prices weren’t affordable, the decline in interest rates didn’t start helping purchases yet, and the volatile stock market increased economic uncertainty. Based on the early findings from the MBA mortgage applications index, it appears the housing market rebounded somewhat in January (although seasonally adjusted purchases fell 2% in each of the past 2 weeks). It doesn’t take a lot for housing to become more affordable when the labor market is close to being filled and real wage growth is accelerating.
An example of why housing may be rebounding a bit in January can be found in the November Case Shiller Home Price Index. The seasonally adjusted 20 city index was up 0.3% month over month which missed estimates for 0.4% and the prior reading of 0.4% growth. On a non-seasonally adjusted basis, the 20 city index was down 0.1% monthly which missed estimates for 0.2% growth and October’s reading of no growth.
As you can see from the chart below, the 20 city non-seasonally adjusted index was up 4.68% year over year which missed estimates for 4.9% and growth of 5% in October.
This is the weakest growth since January 2015 which had 4.38% growth. Growth has been steady in the mid-single digits ever since growth decelerated in the 2nd half of 2014. Let’s see if growth finally breaks this trend in the next few months. The recent growth peak was in March 2018 which had 6.78% growth. That will be the toughest comparison for this index. As we mentioned, mortgage applications signal some improvement in January, which means it’s tough to imagine growth cratering again this month. If price growth falls further, demand for housing will increase. The best solution for a weak housing market is lower price growth.
Seattle & San Francisco Monthly Prices Fall
There was price trouble in the West as in LA and San Diego prices were flat month over month. Year over year price growth was just 3.3% in San Diego. San Francisco and Seattle fell 0.5% and 0.3% monthly. The once hottest markets in the country have been driving the cool down in the 20 city price index.
Phoenix and Las Vegas were very strong as they had 0.7% and 0.5% monthly. They were the two best cities as year over year price growth was 12.1% in Las Vegas and 8.1% in Phoenix. Las Vegas has been one of the hottest markets for a few months. The northeast was still weak yearly, but showed improvement monthly. New York prices were up 0.7% and 0.9% in the past two months, but yearly growth was only 3.5%. Washington D.C. had the weakest price growth of only 2.7%. The government shutdown definitely didn’t help this city in January.
Recent Stock Returns
As you can see from the chart below, from January 11th to January 19th, the homebuilders index underperformed the S&P 500 by 6.79% even though the MBA mortgage applications index showed strong growth then. Maybe their stocks fell because of the negative news on trade or because their stocks were overbought heading into this period. Maybe investors were fearful of the global economic slowdown which could mean the strength in the housing market in January will be short lived.
Since that terrible underperformance, the industry has done well. From January 22nd, to the 29th, the XHB ETF is up 3.09%, while the S&P 500 only rose 0.27%. That’s interesting because the MBA applications index has seen negative growth. Housing stocks were up 1.1% on a down day on Tuesday because traders know this HPI is old news. This recent outperformance suggests the bad previous performance may have been profit taking after a solid run.
If the unemployment rate increases (other than because more people entered the labor market or the one time increase caused by the shutdown) all bets are off for the housing market. We could see year over year price declines.
Student Loans Prevent Millennials From Buying Houses
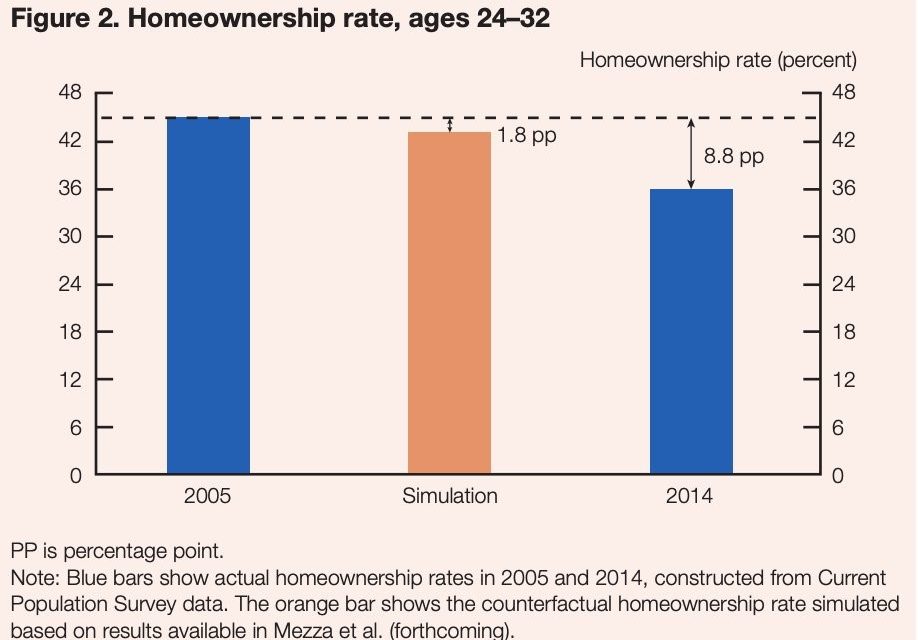
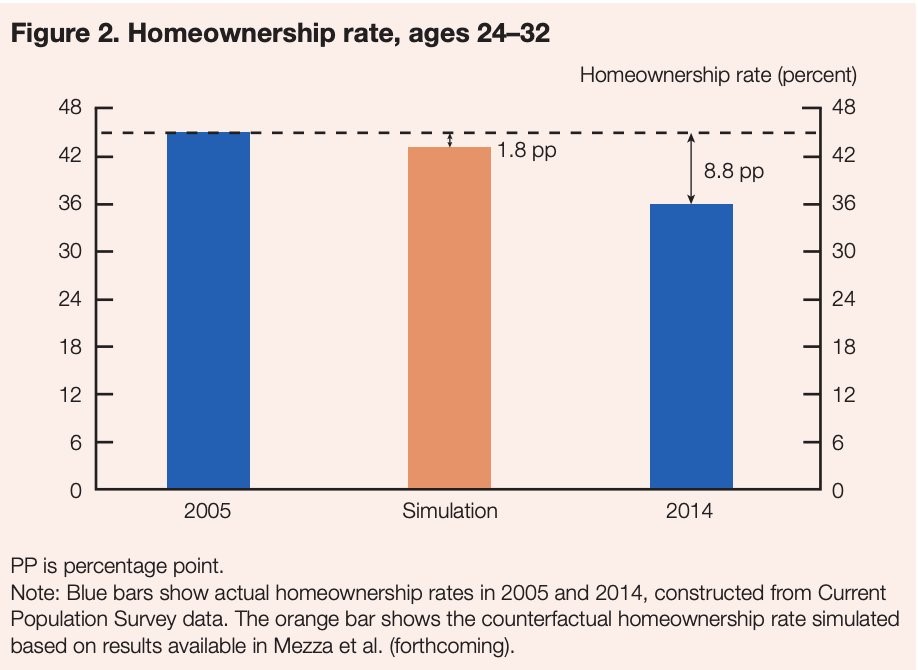
To all millennials, saying that student loans prevented them from buying houses is like saying the sky is blue. They lived through this painful bubble. Obviously, everyone doesn’t have student debt, but everyone knows someone with high debt because the problem is systemic. The Fed conducted importantresearch on this topic. It found that a $1,000 increase in student debt causes a 1-2% drop in the homeownership rate for student loan borrowers in their late 20s and early 30s. It’s a disaster, instead of earning money that compounds, these borrowers’ debt is compounding.
As you can see from the chart below, the homeownership rate of those ages 24-32 has fallen 8.8% from 2005 to 2014. 1.8% of that decline is because of student loan debt. Student loan debt has exploded since 2014; it would be interesting to see the more recent data.
Consumer Confidence Falls
The Conference Board’s consumer confidence reading fell from 128.1 in December to 120.2 in January. The 17.7 point decline since October is the worst string of losses since October 2011. Historically, the difference between the present situation index and the expectations index has forecasted recessions. Everyone who follows this differential jumped out of their seat because the expectations reading fell 10.4 points to 87.3 and the present index only fell 0.3 to 169.6. This seems to indicate a recession is coming. However, that might not be the case because the government shutdown could have impacted sentiment in the short-term, making the expectations index fall more than it would have otherwise. That’s a short term issue which has been partially resolved.
The chart below shows the University of Michigan’s data on the effect of the government shutdown by political party affiliation.
Republicans have become less optimistic because of the shutdown. You shouldn’t be bearish on the economy long-term because of the shutdown. Therefore, the consumer confidence reports from January aren’t a huge deal.
Bad News/Good News
The bad news is the Redbook same store sales growth report from the week of January 26th was 5.8% which fell from 7% in the prior week. That’s down from 9% late last year. The good news is in the weak consumer confidence report, the 6 month buying plans for houses increased 1.9% to 7.8%. The MBA mortgage applications index strength earlier in January has been confirmed by this reading which had a cutoff date of January 17th.
Conclusion
Housing price growth weakened in November. That weakness and lower interest rates helped spark demand for housing in January. Housing stocks have been rallying in the past few days potentially on these prospects. Student loan debt has crushed many millennial’s dreams of ever buying a house. Consumer confidence cratered in January because of the government shutdown, however the impact of the shutdown is temporary.
Have comments? Join the conversation on Twitter.
Disclaimer: The content on this site is for general informational and entertainment purposes only and should not be construed as financial advice. You agree that any decision you make will be based upon an independent investigation by a certified professional. Please read full disclaimer and privacy policy before reading any of our content.


