UPFINA's Mission: The pursuit of truth in finance and economics to form an unbiased view of current events in order to understand human action, its causes and effects. Read about us and our mission here.
Reading Time: 4 minutes
The June JOLTS report told us the same thing that the July monthly BLS report did. The labor market is seeing slowing growth. In May, there were 7.384 million job openings which was a positive revision from 7.323 million. In June, there were 7.348 million which beat estimates for 7.293 million and the high end of the expected range which was 7.325 million. That’s a 0.6% yearly decline. Job openings peaked at 7.626 million in November 2018. We only have proper data from the last cycle because this report started in 2000. In the last cycle, job openings peaked in May 2007 which was 8 months before the recession. This is only one data point and therefore should not be the sole basis to form a thesis around, but if the same thing were to happen, there would be a recession starting in August 2019. Openings didn’t fall much prior to the 2007-09 recession, so the fact that they are currently near their high isn’t a problem for the recession call based on historical context.
June JOLTS Report
Job openings in the construction industry fell from 376,000 to 347,000 which makes sense because of the 2.1% decline in construction spending in June. Openings are down 87,000 in the past 2 months, but this is a volatile industry. There was a spike in openings in retail from 815,000 to 888,000, but in food services openings fell from 916,000 to 835,000. On a yearly basis, accommodation and food services openings fell 8.2% which is the biggest decline since March 2010 when the economy was just coming out of the 2007-09 recession.
Hires have been far below openings for a while. That wasn’t a big issue when both were increasing on a yearly basis, but now they are falling. In June, hires fell from 5.76 million to 5.702 million. As you can see from the chart below, hiring fell 2.2% from last year. That’s the worst reading since February 2017.
The situation is the reverse of openings for construction and food services as their hiring increased from 387,000 to 414,000 and from 933,000 to 1.009 million. Retail trade hiring was also up as it went from 770,000 to 795,000. On a yearly basis, restaurant hiring was up 13.6%, construction hiring was up 9.5%, and retail trade hiring was up 3.9%. These are all great readings. Finally, the quits rate was steady at 2.3% which is 0.2% off the record high. The quits rate is the highest in restaurants as it is 4.7%. It is the lowest in government as it is 0.8%.
Recession Indicator Goes Wild
As of August 2nd, the NY Fed’s recession probability index hit 31.48%. That doesn’t sound like a scary percentage chance of a recession in the next year. However, for this reading it is high as it has almost always signaled a recession is coming based on data since 1960.
The treasury spread is about to get more coverage because the difference between the 10 year yield and the 2 year yield has been falling. It hit 8 basis points for a moment on Wednesday, which is below the previous low of this cycle in December 2018. Don’t be fooled into thinking this NY Fed indicator guarantees a recession, but realize that if the 10-2 spread inverts, there will be a lot of negative press, which might scare investors. The 10-2 spread started this cycle as the most popular yield spread for predicting recessions.
Recession Versus Insurance Cuts
In the past few trading days, it has become more likely that this is the start of a cut cycle rather than a one off cut. This is less likely to be a midcycle adjustment or an insurance cut like in 1995. The odds of at least 2 more rate cuts in 2019 are at 92.7%. 3 total rate cuts in 2019 seems like the start of a cut cycle. As you can see from the bottom chart below, the stock market craters after recession cuts and rallies after insurance cuts. On the other hand, the 10 year yield falls in both scenarios on average.
Bullard, who is a dove, spoke on Tuesday. When asked about the possibility of more cuts, he stated, it’s “not clear you want to pile on more [easing].” Even he’s not sold on this being a new cut cycle, although, he didn’t rule out more rate cuts. Ruling out more rate cuts would cause markets to go insane. On the other hand, cutting 2 more times this year would go against the Fed’s claim the July cut was just a midcycle adjustment.
Home Price Growth Falls Again
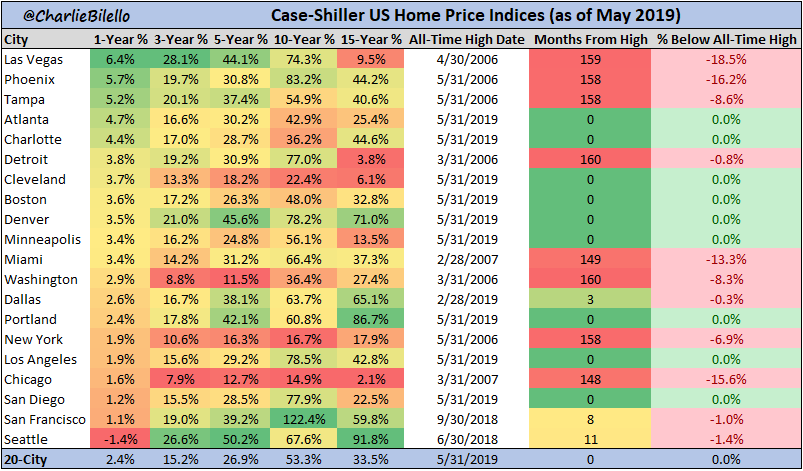
Housing is headed towards being more affordable as home price growth has been falling and mortgage rates are at a 3 year low. The Case Shiller 20 city non-seasonally adjusted home price growth rate fell from 2.5% to 2.4% in May. The national growth rate fell from 3.5% to 3.4%. That’s the lowest growth rate since September 2012. As you can see from the table below, the once hot Seattle market is now in contraction as prices fell 1.4%.
On the other hand, Washington D.C., which hasn’t had explosive growth in the past couple of years, saw its growth rate increase from 2.7% to 2.9%.
Strong Pending Home Sales
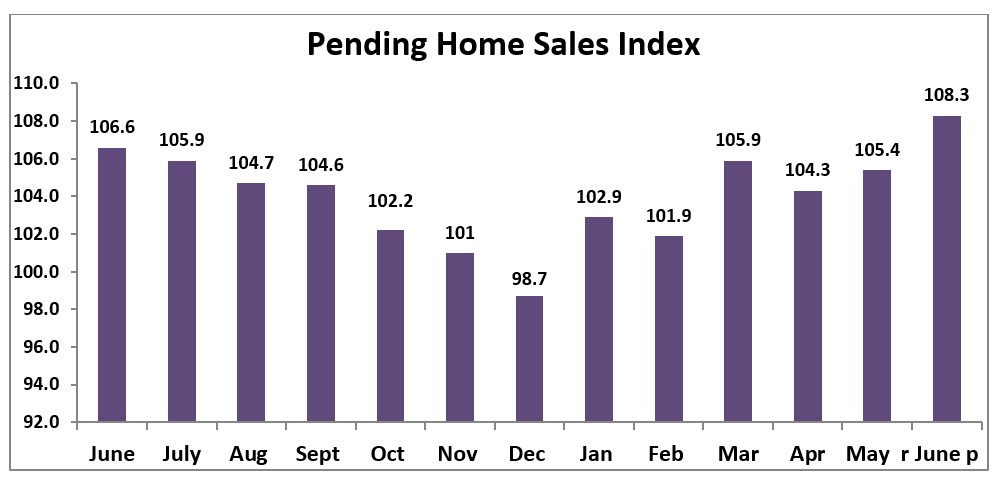
The June pending home sales report signals good things about the future housing market as the index was up 2.8% monthly to 108.3. It’s yearly growth rate was 1.6% which ended its streak of 17 months of declines. This reading leads existing home sales by 1-2 months. Every region saw an increase from last year as the South increased from 124 to 125.7, the West increased from 94.4 to 96.8, the Northeast increased from 93.7 to 94.5, and the Midwest increased from 101.9 to 103.6.
Conclusion
The June JOLTS report showed hiring and openings fell yearly. On the positive side, yearly hiring growth was positive at restaurants, retail stores, and construction. The yield curve signals a recession is coming as the 10-2 year curve has been flattening. The Fed funds futures market signals this is the start of a rate cut cycle which implies a recession is coming. That’s bad for stocks. The housing market is starting to get more palatable to home buyers as rates are very low and national price growth is 3.4%. Pending home sales ended a 17 month streak of yearly declines in June.
Have comments? Join the conversation on Twitter.
Disclaimer: The content on this site is for general informational and entertainment purposes only and should not be construed as financial advice. You agree that any decision you make will be based upon an independent investigation by a certified professional. Please read full disclaimer and privacy policy before reading any of our content.


