UPFINA's Mission: The pursuit of truth in finance and economics to form an unbiased view of current events in order to understand human action, its causes and effects. Read about us and our mission here.
Reading Time: 4 minutes
When we have positive headlines, less people are interested in the content than if the headline was negative. That’s unfortunate, but regardless of whether the data is positive or negative, our goal is understanding reality.
The housing data in the past couple of weeks has almost been all good. The MBA mortgage applications report from the week of September 20th showed weekly purchase growth of -3% on top of 6% growth which isn’t terrible given the jump in rates. The week of September 20th dealt with the increase in treasury yields from early in September which will likely diminish given the decline in yields since then. This report was still solid because purchase applications were up 9% yearly.
The new home sales report was a continuation of the other great housing reports this summer. The July reading was revised up from 635,000 to 666,000. The June reading still is a cycle high which makes a recession highly unlikely in the next few quarters. As you can see from the chart below, there were 713,000 new homes sold in August which beat estimates for 662,000 and the high end of the consensus range for 685,000.
Because of this reading and the positive revision, the 3 month average hit a cycle high. That’s how declining rates help the housing market which had excess inventory in 2018. The 3 month average new home sales was the highest since October 2007 which was before the subprime crisis. Before you get worried, new home sales peaked in July 2005 which was over 2 years before the recession started.
Housing Starts Boom Coming
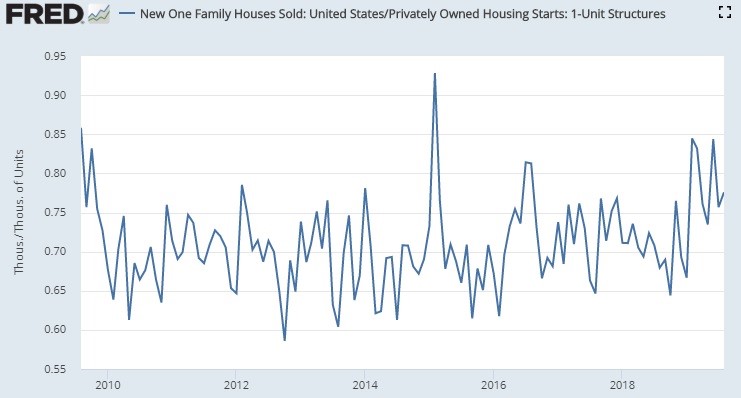
New home sales were up 18% year over year. New home sales usually run about 70% of single family housing starts. They have surpassed that level in each of the past 7 months. The percentage is now 77.5% as you can see from the chart below. That signals housing starts will increase soon.
The other signal that a construction boom is coming, which will boost real residential investment growth, is the decline in new single family home inventories.
Inventories fell 1.2% to 326,000. In terms of sales, inventories fell from 5.9 months to 5.5 months. That’s the lowest since June’s 5.4 months. The inventory glut that built up in 2H 2018 because of affordability issues has been removed. The glut peaked at 7.4 months in December 2018. This was a smooth transition because of the decline in rates. We say this was smooth because national home prices never fell. If mortgage rates were to spike back to their highs from late last year, the Case Shiller yearly growth rate might be flirting with the flatline.
Prices Increase To A Record High
Median house prices increased and the average hit a record high because expensive new home sales did well. That’s partially because the West was the strongest region. Specifically, median price growth was 7.5% monthly as it reached $328,400. Yearly growth improved from the negative single digits to 2.2%. It’s no surprise prices increased since inventories were relatively low. This is becoming more of a sellers’ market. The average new home price was $404,200 which is a record high. Yearly growth of 6.1% was the strongest growth in 21 months. That’s wildly different from the Case Shiller index’s 3.2% growth which was the lowest since September 2012 (new home sales from August & Case Shiller from July).
As we mentioned, the West had a great month. New home sales in the West increased 16.5% monthly and 17.9% yearly. That drove prices higher because the West is the most expensive housing market. Sales in the South were up 6% monthly. The South is 60% of the new home sales market. Sales in the Northeast and the Midwest both fell 2,000, but they’re so small they barley have an impact on this report. It’s mainly about the South and the West.
Downpayment Is The Issue
The main reason housing isn’t affordable is down payments. It makes sense down payments are a much bigger issue than monthly payments because rates have fallen. The decline in rates certainly has improved home price growth in the past few decades. As you can see from the chart below, it only takes nonsupervisory and production workers 51.7 hours of work per month to pay for the median new home assuming they put 20% down.
This chart actually makes it look worse for workers because most people buy existing homes which are cheaper. Obviously, buyers don’t need to put 20% down. First time buyers put 6% down on average. That increases monthly payments.
Cyclical Struggles Not Trade War
The Atlanta Fed report suggests cyclical weakness is a bigger issue than the trade war. The uncertainty index fell from 97.4 to 90.2 which means there is less uncertainty. As you can see from the chart below, this relatively low level of uncertainty (record high is 110.8 & record low is 80.6) allowed the capex index to hit a record high (increased from 112.1 to 120).
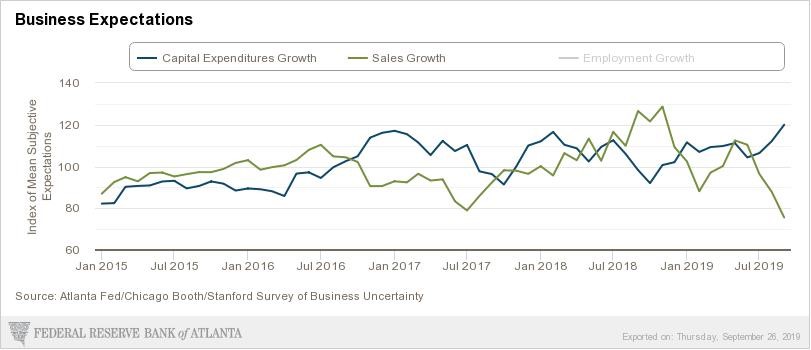
On the other hand, the expectations index fell from 91.7 to 86.5 which is a record low. This survey started in January 2015. Weakness in sales growth drove expectations lower. As the chart above shows, the sales growth index fell from 87.9 to 75.6 which is a record low. It’s very odd to see such a divergence between capex growth and sales growth.
President Warren?
With Warren’s rise in the polls, the market is starting to price in her presidency. She has a 24.7% chance of being elected president in 2020. As you can see from the chart below, her odds of winning the Democratic primary increased to above 50%. That’s because 2 national polls showed her winning by 1 and 2 points. Biden’s average polling lead fell to 6.7% which is the lowest of this election cycle.
Conclusion
The housing market is being driven by the decline in rates. The yield curve inversion was a good thing because long yields fell which sunk mortgage rates. If there is a burst in housing starts in Q4 like new home sales suggest, real residential investment growth will accelerate higher. The Atlanta Fed survey shows capex growth is expected to be very strong and businesses are very pessimistic about sales growth in the next year. Elizabeth Warren is leading the latest national Democratic primary polls. She has about a 25% chance of becoming president.
Have comments? Join the conversation on Twitter.
Disclaimer: The content on this site is for general informational and entertainment purposes only and should not be construed as financial advice. You agree that any decision you make will be based upon an independent investigation by a certified professional. Please read full disclaimer and privacy policy before reading any of our content.


