UPFINA's Mission: The pursuit of truth in finance and economics to form an unbiased view of current events in order to understand human action, its causes and effects. Read about us and our mission here.
Reading Time: 4 minutes
The stock market is at a very interesting juncture because its rally has been impenetrable despite the global economic slowdown. The 20% decline late last year probably wasn’t warranted because there are few signs America is headed for a recession. The trade war cooling off and the dovish Fed have also acted as positive catalysts to drive stocks higher. President Trump stated he wouldn’t raise tariffs on China on March 1st because progress is being made with the negotiations. The Fed had gone from projecting 3 rate hikes in 2019, to expressing that it will have patience because of the global slowdown. At the Fed’s next meeting in March, it should project fewer than the 2 hikes it guided for in December.
Just because stocks should be higher than the Christmas Eve bottom and there were two positive catalysts since then doesn’t mean stocks should rally indefinitely especially since the economy is mixed at best. Specifically, as of February 25th, the S&P 500 was above its 10 day moving average for 35 days which is the longest streak in 9 years. The longest streak ever was 59 days in 1971. The chart below shows the historical 2 month rate of change of the S&P 500. The S&P 500 is up 18% in the past 2 months which is only comparable to April 2009, November 2001, December 1998, March 1991, October 1982, and February 1985.
It’s human instinct to immediately sell sharp rallies because you think they can’t continue. However, you need to do more research than just looking at the price action because there are numerous instances where rallies have led to more rallies. For example, when the stock market has been up in January and February since 1950, stocks are up in the next 10 months 25 out of 27 times. The average return is 12.1%. When the 12 month rate of change in the S&P 500 goes from -5% to positive (similar to now), it’s almost always a bullish sign.
Margin Disaster Might Be Coming
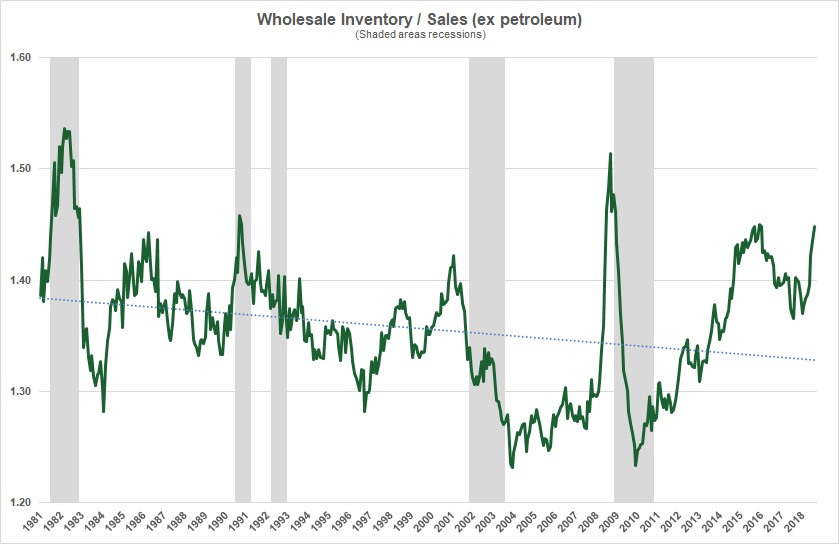
Stock returns are based on expected earnings in the long run. There can be multiple expansion, but don’t let that distract you from following the economy and earnings estimates. Margins look like they will fall in the coming quarters because the wholesale inventory to sales ratio has exploded higher as the chart below shows.
In the December report, monthly wholesale inventory growth was 1.1% which beat estimates for 0.3%. The November reading was revised from 0.3% to 0.4% growth. This was set against a 1% monthly decline in wholesale sales in December. Durable inventories grew 1.5% as there were builds in metals, furniture, electrical goods, and lumber. Year over year inventories were up 7.3% and sales fell 1.5%. The stocks to sales ratio increased from 1.3 to 1.33.
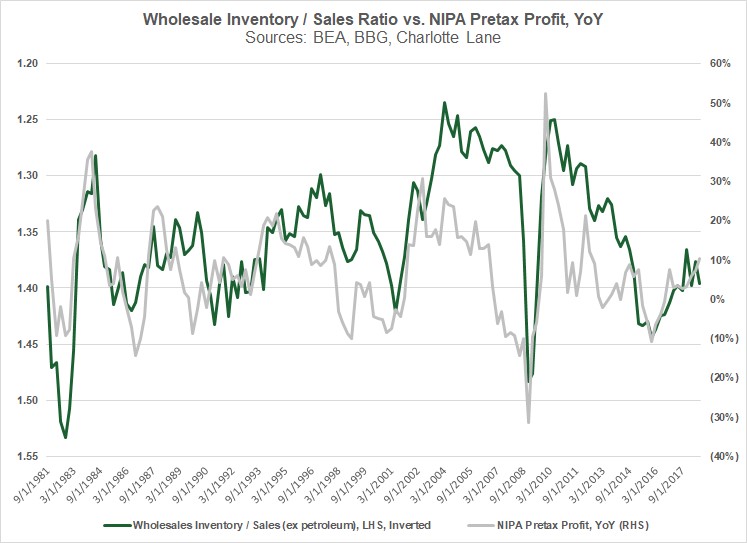
Increases to inventories helps GDP, but in the intermediate term, it hurts margins if sales don’t increase as well. Firms need to discount products when inventory has been built up too much. As the chart below shows, the wholesale inventory to sales ratio (excluding petroleum) is highly correlated with NIPA (National Income & Product Accounts) profit growth. Profit growth won’t last in this bloated inventory environment.
Earnings Scout Signals Stocks Are Overvalued
It’s not ideal for stocks to rise dramatically when earnings estimates are plummeting. There might not be an earnings recession in 2019, but the weak global economy is certainly hurting the internationally focused sectors such as technology. The chart below shows positive and negative earnings revisions versus the S&P 500.
Stocks were overvalued in January and September 2018 because there where high negative revisions and low positive revisions, relative to the stock market. They were undervalued for the opposite reason in March and December 2018. Now, we are seeing high negative revisions and low positive revisions versus the stock market which is a sell signal.
As we mentioned, the S&P 500 has experienced multiple expansion in 2019. Investors liked the low forward PE multiple of 13.92 to start the year. They have bid up stocks to a forward PE multiple of 15.96 which is much more expensive. Your opinion on whether to buy or sell stocks should be at least partially based on the trajectory of the global economy.
Global Recession Coming?
Ned Davis Research’s global recession probability model is at 95.93%. The global economy always has been in a recession when the indicator has gotten this high since 1970. To be clear, by the time the OECD claims there was a global recession, it might be over. GDP growth doesn’t need to be negative in a global recession. There have been 2 global recessions since the 2008 financial crisis. Since 1961, global GDP growth has only been negative in one year (2009). As we mentioned in a previous article, the Q1 WTO trade indicator fell to 96.3 which is ‘below trend’ growth. It’s the weakest reading since March 2010.
As you can see from the chart below, quarter over quarter real world export growth fell to 1.8% in December which is a 2 year low.
Based on Taiwan new export orders, Korean first 20 day exports, the Baltic dry price index, and world PMI’s new export orders, real world export growth should fall further.
Poor PMIs Are Bad For Earnings
A weak global PMI signals weak earnings growth. The chart below shows the 50.7 global manufacturing PMI implies forward global earnings will weaken.
The global PMI also forecasts S&P 500 trailing EPS earnings. The correlation is high when you advance the PMI by 9 months. The weakest 3 global sectors in January were forestry & paper products, metals & mining, and automobiles & auto parts.
Conclusion
Stocks have rallied in 2019, but it might be time for caution because the wholesale inventory to sales ratio is high and negative earnings revisions are high versus the market. The S&P 500’s forward PE multiple has risen to near 16. The global economy looks weak as real quarter over quarter export growth fell to a 2 year low. When the global PMI is weak it’s bad for global and S&P 500 earnings. The positives catalysts which are the dovish Fed and trade war cool down have been priced in, but the cyclical negatives haven’t been.
Have comments? Join the conversation on Twitter.
Disclaimer: The content on this site is for general informational and entertainment purposes only and should not be construed as financial advice. You agree that any decision you make will be based upon an independent investigation by a certified professional. Please read full disclaimer and privacy policy before reading any of our content.


