UPFINA's Mission: The pursuit of truth in finance and economics to form an unbiased view of current events in order to understand human action, its causes and effects. Read about us and our mission here.
Reading Time: 4 minutes
Our review of the January labor report must start with the large headline surprise. The expectations were for 158,000 jobs created and instead 304,000 were created. This is the 2nd big beat in a row. The sour note of this report was last month’s reading was revised down by 90,000 to 222,000. The chart below calculates the 6 month moving average of the standard deviations in the surprise rates of payrolls, core CPI, and average hourly earnings.
The recent payrolls beats have been exceptional, implying the potential for a mean reversion. Either economists will raise their estimates or results won’t maintain their recent heightened pace. Specifically, the monthly standard deviation in the latest payrolls report was 76,000, making the beat 1.8 standard deviations. Unlike payrolls which are limited by the supply of labor, hourly earnings growth can accelerate at this point in the cycle because the economy is strong and there’s less slack in the labor market. This standard deviation should be limited by increasing expectations. Finally, core CPI growth has recently been limited by the stabilization of shelter inflation. Shelter inflation still drives core CPI growth, but no longer at an accelerated rate.
Very Strong Weekly Wage Growth
This labor report was great because there was huge job creation. The U6 unemployment rate increased because the civilian non-institutional population fell more than the labor force. The U6 rate rose because of the government shutdown.
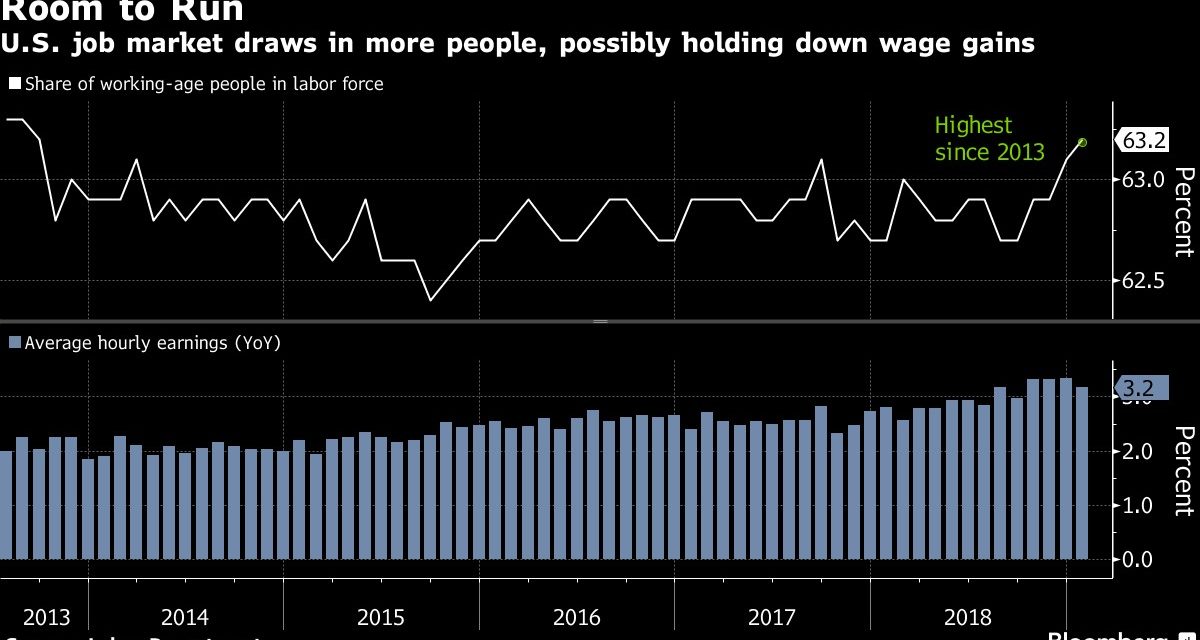
The top chart below which shows the overall labor participation rate increased to 63.2% from 63.1% which is the highest rate since September 2013. Many economists expect the labor participation rate to fall over time because of aging demographics. Any sign of life is a huge victory.
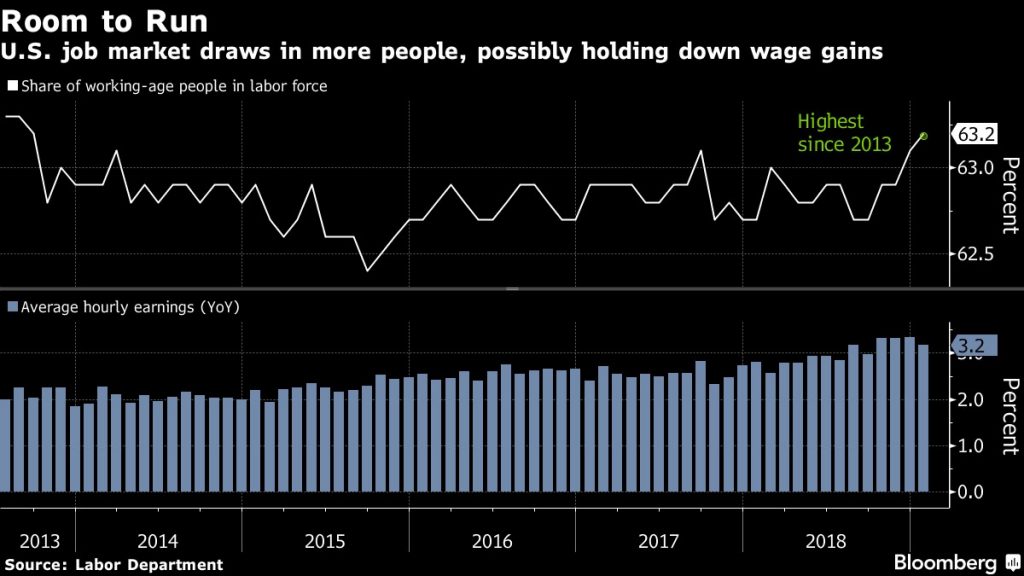
Average hourly earnings growth was up 0.1% monthly which missed estimates for 0.3% and last month’s reading of 0.4%. However, the deceleration seen in the bottom chart above isn’t evidenced by weekly earnings growth which increased from 3.34% to 3.48%. The cycle high was 3.63% in October 2018.
One of the reasons this expansion has been so long is the 2008 financial crisis was so deep it created a huge amount of unemployed and discouraged workers. This supply of labor (slack) has limited wage growth throughout the cycle and provided firms with an ample supply of workers to help grow their businesses. On the other hand, high wage growth encourages more people to come off the sidelines. Also, low slack in the labor market makes employers more willing to train workers who have limited experience or have been out of the labor market for a long time.
The Labor Market Is Almost Full
Because the labor force participation rate is dragged down by demographics, the best way to compare this cycle to previous ones is to adjust for demographics. The demographically adjusted labor force participation rate is near the 2006-2007 average.
There is still room for the demographically adjusted labor force participation rate to increase to get to the 1999-2000 average. Specifically, the prime age labor force participation rate was 82.6% in January which was a 0.3% increase from December. That’s a huge increase considering how close it’s getting to the last 3 cycle peaks.
It peaked at 83.4% in the prior cycle, 84.6% in the late 1990s, and 83.8% in the early 1990s. It is up 0.8% in the past year. If it increases at the same pace for the next 19.5 months, it will reach the average peak in the past 3 cycles. The labor cycle could peak in Q3 2020. It’s important to look at what happens after the peak, which we will do after the rate increases further. As for now there’s still supply in the labor market. It won’t last long if reports like January continue, but that’s unlikely.
The Consumer Should Be Strong
Consumer confidence rolled over in January because of political uncertainty. We think it’s a blip on the radar because the labor market is strong, wage growth is strong, and inflation is steady. Limited inflation, a dovish Fed, and a strong labor market is a recipe for a great consumer and an outperforming American economy.
As you can see from the chart below, the combination of jobs, hours worked, and hourly earnings for production and non-supervisory workers is up 0.3% monthly and 5.9% yearly. That’s the quickest yearly growth this cycle.
That acceleration is coming as the consumer price index’s growth rate falls. The gap between the two is large and expanding. There is very little chance of a recession in 2019 based on this chart.
Crown Jewel For Consumers
The crown jewel for consumers is wage growth being faster than shelter inflation. The high cost of shelter has prevented an increasing number of millennials from moving out even if they have jobs.
As you can see from the chart below, for most of this cycle rent inflation has been above average hourly earnings growth.
The upward revision in hourly wage growth in December caused the rate to be above rent inflation for the first time in nearly 8 years. The obvious hope is this is just the beginning for workers because it will take years of wage growth being higher than rent price growth to get back to where the cycle started. Generation X had an easier time affording rent when they first moved out into an apartment than millennials have had.
Construction Job Growth Too High?
In January, there were 52,000 construction jobs added, making it the industry with the 3rd biggest job creation. This growth was almost double the 27,000 average job creation in the previous 12 months. This growth might not be sustainable as the chart below shows.
From 2011 to 2014 construction revenues were up 40%, volume was up 17%, and jobs were up 17%. Job growth was up only 1% less from 2015 to 2018, yet revenue growth was 14% less and volume growth was 9% less. Since July 2017, jobs are up 8% more than volume. That trend is unsustainable.
Conclusion
There is much more to this great jobs report that we didn’t get to yet. The takeaway from this article, is the supply of labor in the labor market is still large enough to last for a few more quarters. That means job creation can continue. High job growth, accelerating wage growth, and muted inflation is great for workers. Shelter inflation has been falling lately. Watch out for construction job growth because it may be peaking.
Have comments? Join the conversation on Twitter.
Disclaimer: The content on this site is for general informational and entertainment purposes only and should not be construed as financial advice. You agree that any decision you make will be based upon an independent investigation by a certified professional. Please read full disclaimer and privacy policy before reading any of our content.


