UPFINA's Mission: The pursuit of truth in finance and economics to form an unbiased view of current events in order to understand human action, its causes and effects. Read about us and our mission here.
Reading Time: 4 minutes
Most of the housing data from November and December was terrible, so the weak December pending home sales index shouldn’t be a surprise. It was a surprise to economists as the pending home sales index was down 2.2% month over month which missed the consensus for 0.3% growth. Furthermore, the November reading was revised to show a 0.9% decline instead of a 0.7% decline. The big issue with the housing market in December is lower interest rates didn’t drive demand.
One critical bullish thesis in 2018 was that the housing market was only weak because of rising rates. We will see if that’s true in the next few months because rates have declined. If that’s not true, either affordability is a problem (rates aside), or the economy is weaker than we thought. It’s not a shock to those negative on the housing market that the housing market became unaffordable in 2018 as the University of Michigan survey has shown home buying conditions have been weak.
The MBA applications index showed home buyers at the top of the funnel became interested in buying a house. The pending home sales data is more accurate than that information as it measures signed contracts; it is also a leading indicator for the housing market. 80% of pending home sales close. They close an average of between 4-8 weeks, meaning existing home sales should be weak in the first two months of 2019.
New Home Sales Data Surprisingly Strong
We finally found a housing data point that was strong in November. Seasonally adjusted new home sales were 657,000 in November as you can see from the chart below.
That beat estimates for 560,000 and October’s reading of 562,000. It was the best reading since March 2018. New home sales increased 16.9% as every region saw growth except the West. The South, which is the largest housing region, saw new home sale growth of 20.6%. The West was down 5.9% monthly and 25.9% yearly. Overall, year over year sales were down 7.7%. Supply only increased 0.6% to 330,000. As the chart shows, the monthly supply of homes fell from 7 to 6 months. That’s about half the bubble peak supply.
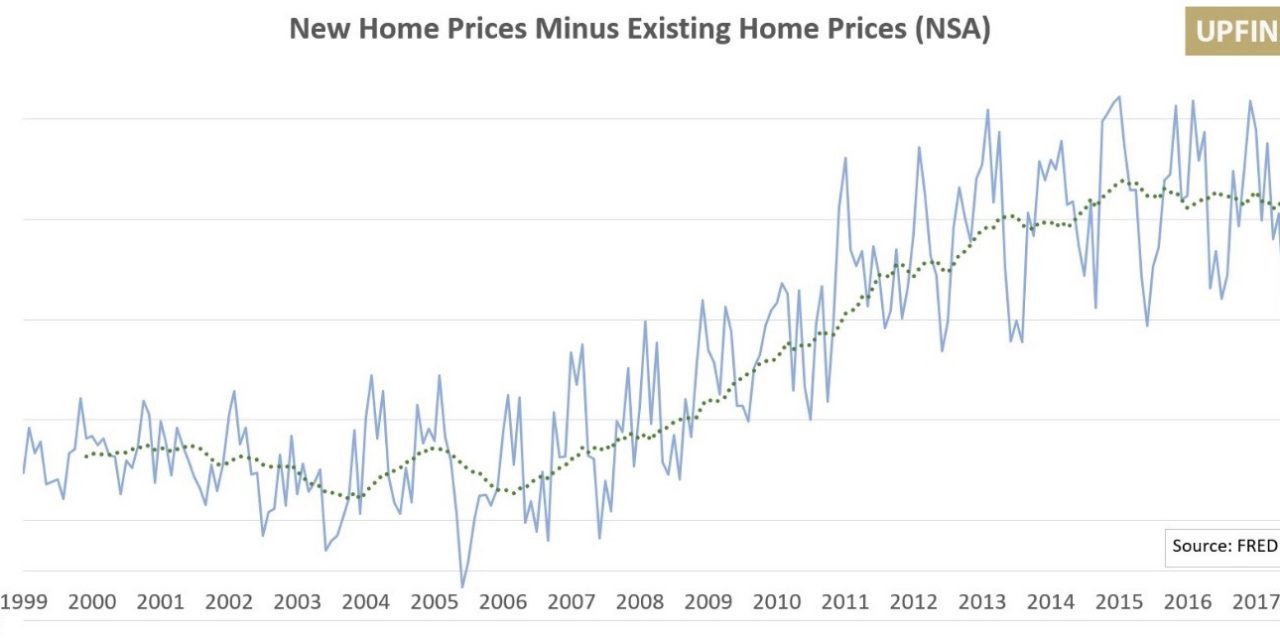
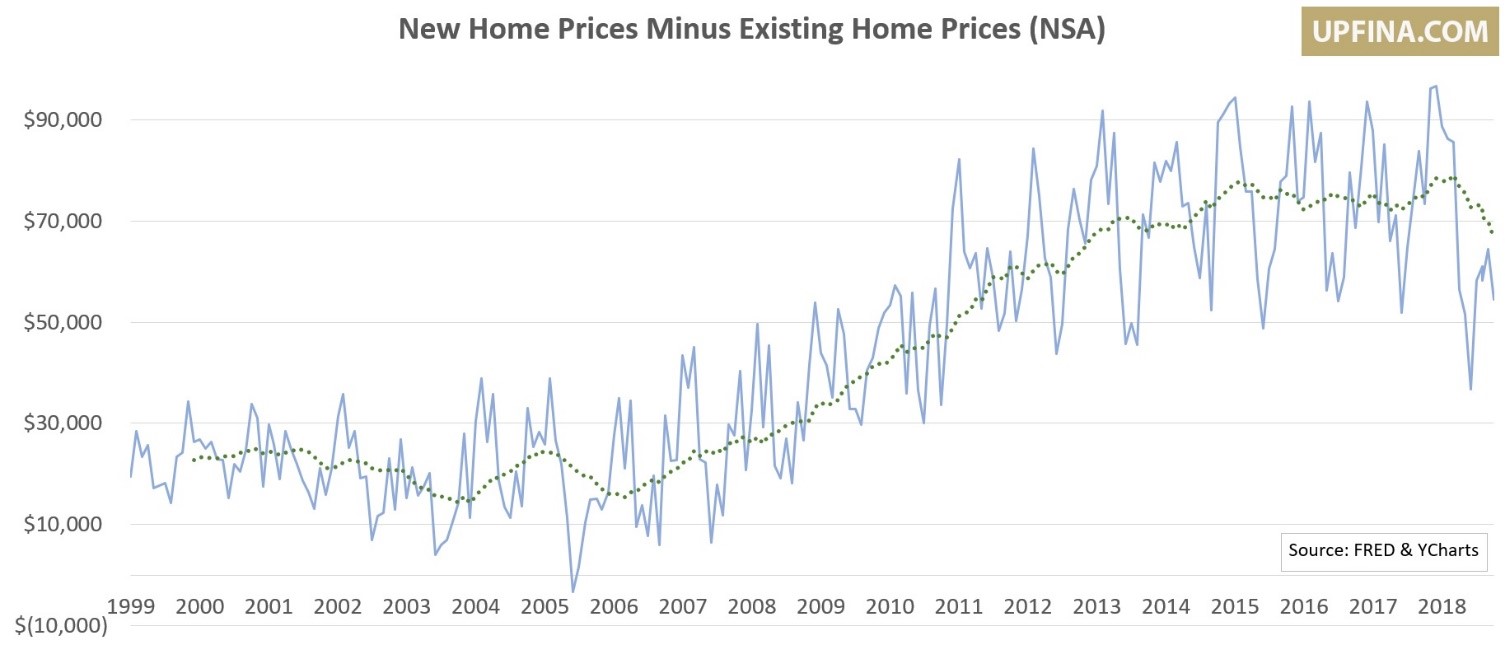
The Achilles heal of this report is sales prices fell. Builders discounted houses to drive volume. This supports the notion that home prices aren’t affordable. Price cuts will bring millennials off the sidelines and into new houses. Specifically, the yearly median price cut was 11.9% to $302,400. This was a 7% monthly drop. 49% of new home sales were under $300,000. That’s the most since February 2017. It’s good to see cheaper new home prices because the lack of supply of entry level housing has prevented millennials from living up to their housing demand potential.
Q4 GDP Growth Was Solid
Q4 2018 is in the rear view mirror, but we still don’t have the initial GDP report because of the government shutdown. It’s tough to say when the report will be released because if the BEA announces it will come out after February 15th, another government shutdown could delay it further.
All indications are that Q4 GDP growth was above 2% on a quarter over quarter annualized basis. The CNBC tracking estimate for Q4 growth has median estimates at 2.7% as of February 1st. The Atlanta Fed GDP Nowcast was unchanged from January 22nd to January 31st even though the housing data caused the estimate for real residential investment growth to fall from -4.3% to -5%. The latest estimate from February 1st is for 2.5% growth. The housing market is a huge negative for Q4 GDP growth. That’s why a housing rebound can power an economic growth acceleration in 2019.
Unemployment Claims Skyrocket
Jobless claims for the week of January 25th exploded higher. Claims increased from 200,000 to 253,000 which is a 16 month high. Another increase of this size would set off a recession warning. However, this is highly unlikely as the government re-opening will lower claims. 15,000 claims came from furloughed Federal employees, meaning most won’t occur next week. That reading was down from 25,000 in the previous week. We don’t know the details of the government contractors, but they probably caused part of this spike because they won’t be getting back pay unlike Federal workers. The 4 week moving average only increased 5,000 to 220,250 as the chart below shows. Let it rise above 275,000 before you get nervous. There’s no cause for concern here just yet.
Employment Cost Index
Workers are finally getting their due this cycle as the labor market is nearing full employment. The Q4 Employment Cost Index increased 0.7% on a quarter over quarter basis and 2.9% on a year over year basis. Quarter over quarter growth missed estimates for 0.7% and Q3’s reading of 0.8%, but it’s still great news for workers. Benefit costs were up 0.7% quarterly and 2.8% yearly which was an acceleration of 0.2%. As the chart below shows, wages and salaries growth was stronger as it increased 3.1% yearly and 0.5% quarterly. This was the highest yearly growth since Q3 2008.
Rate Cuts Might Not Be Coming
With the Fed pausing rate hikes for at least the next few months, investors are wondering when the Fed will cut rates and when the next recession will occur. As you can see from the chart below, the average number of months from the last hike of the cycle to the first cut is 4.75.
The huge logical flaw in this chart and reasoning is the assumption that the last hike occurred. The Fed could easily pause for 9 months and hike again if the economy and stock market improve.
Conclusion
The weak housing market is pulling what would be great Q4 GDP growth lower. The labor market is still strong even though the jobless claims spiked. The ECI shows compensation growth is coming in the form of wages and salaries more than benefits. Everyone is speculating that the cycle has ended because the Fed is pausing hikes. The Fed paused hikes from December 2015 to December 2016 and there wasn’t a recession or string of rate cuts that followed. During that period we were at the beginning of the hike cycle, whereas now we are closer to the end.
Have comments? Join the conversation on Twitter.
Disclaimer: The content on this site is for general informational and entertainment purposes only and should not be construed as financial advice. You agree that any decision you make will be based upon an independent investigation by a certified professional. Please read full disclaimer and privacy policy before reading any of our content.


