UPFINA's Mission: The pursuit of truth in finance and economics to form an unbiased view of current events in order to understand human action, its causes and effects. Read about us and our mission here.
Reading Time: 5 minutes
Investors and analysts never rest on their laurels if the current situation looks good; they are always focused on the bleeding edge of data. Figuring out if past results have been priced in to markets is difficult. Sometimes the market ignores improved economic fundamentals because of a temporary geopolitical issue. Then it circles back to the fundamentals after the issue has passed. You can argue the market is pricing in the geopolitical headwinds just like economic data, but often nothing ends up as a result of rumors and sometimes these issues get blamed for volatility caused by other reasons such as the technicals. It’s difficult to grasp how geopolitical issues affect stocks because the possible negative event is ever changing. With the economy, the risk event is always the same- a slowdown in growth.
The latest data is easier to focus on because you can tell if the market has the results priced in by how it reacts after the reports come out and how the numbers look in relation to analysts’ estimates. An example of how investors are always on the bleeding edge of results is as of the first week of June investors are already focused on the change in earnings estimates for Q3 even though Q2 earnings season hasn’t occurred yet. Furthermore, the big question on Wall Street is if US economic growth will peak in Q2. It’s good news for stocks that the discussion is about the negative as it means sustained growth in 2018 could beat future estimates.
Has Economic Growth Peaked?
The current GDP tracker from CNBC, which averages 10 estimates, shows Q2 GDP growth is on pace to be 3.7% with the hard data from April out and the soft data from May mostly out. If Q2 GDP growth is above 3.1%, real GDP growth will have increased for 8 straight quarters which has never been done before in 70 years of data. If US growth was following the trajectory of the other advanced economies, that streak wouldn’t have been achieved. The reason many investors are questioning U.S. growth is because it is one of the few economies which is thriving. India is another thriving economy as GDP growth in Q1 accelerated to 7.7% which is a big increase from the bottom in Q2 2017 which was 5.6% growth.
The Sustainability Of Q2 Growth
The question of whether U.S. growth can continue regardless of where the global economy is headed is answered by looking at what’s sending growth higher in Q2. One problem with current economic growth is there has been an increase in industrial production because of spending on utilities and mining because of heightened energy costs. That might not be sustainable since oil prices are volatile. It’s also not a good thing for costs to be increasing. Another factor which increased spending on utilities is that April was the coldest month in over 2 decades. It will be interesting to see how the results are altered in May since it was the hottest May on record. Lowered fuel costs could be good for consumer spending on items elsewhere, but the consumer might save this extra money since the increased consumption caused the savings rate to drop.
Tax Savings Given Back?
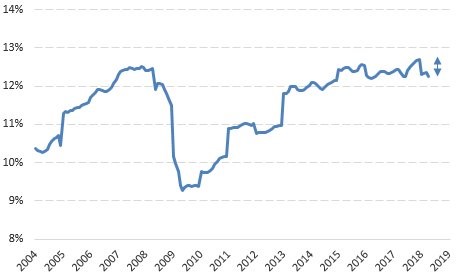
One great data point which might indicate sustainable growth is that real personal disposable income growth accelerated from 1.67% to 1.93% in April. The elephant in the room is the tax cuts. If energy prices stabilize, then the tax cut savings which were ‘taken away’ can be given back. The chart below shows the U.S. personal income tax rate in real time using the BEA personal income and expenditure data.
There has been only a modest decrease in the tax rate paid so far. The increase in rates paid because of the cyclical expansion makes the altered tax law look insignificant.
Aircraft Orders Should Rebound Soon
One economic data point which is weaker than it normally would be at this stage of the cycle is the durable goods orders. It was weak in April because of a temporary decline in aircraft orders. The headline durable goods orders report goes directly into the GDP calculation, but the underlying growth tells us the real trajectory of the economy. In April, the civilian aircraft orders were down 28.9% month over month. This is following increases of 60.8% and 14.5% in the past two months. This is a very volatile metric which is why the ex-aircraft orders are followed more closely by economists. If aircraft orders rebound in the next few months, GDP will be increased.
Strong ISM Manufacturing Report
The ISM manufacturing and non-manufacturing reports were both solid. These are examples of soft data reports with small sample sizes which suggest economic growth in May will be strong. The non-manufacturing ISM composite index was 58.6 which is equivalent to 3.5% GDP growth. The manufacturing ISM composite index was 58.7 which is consistent with GDP growth of 4.8%.
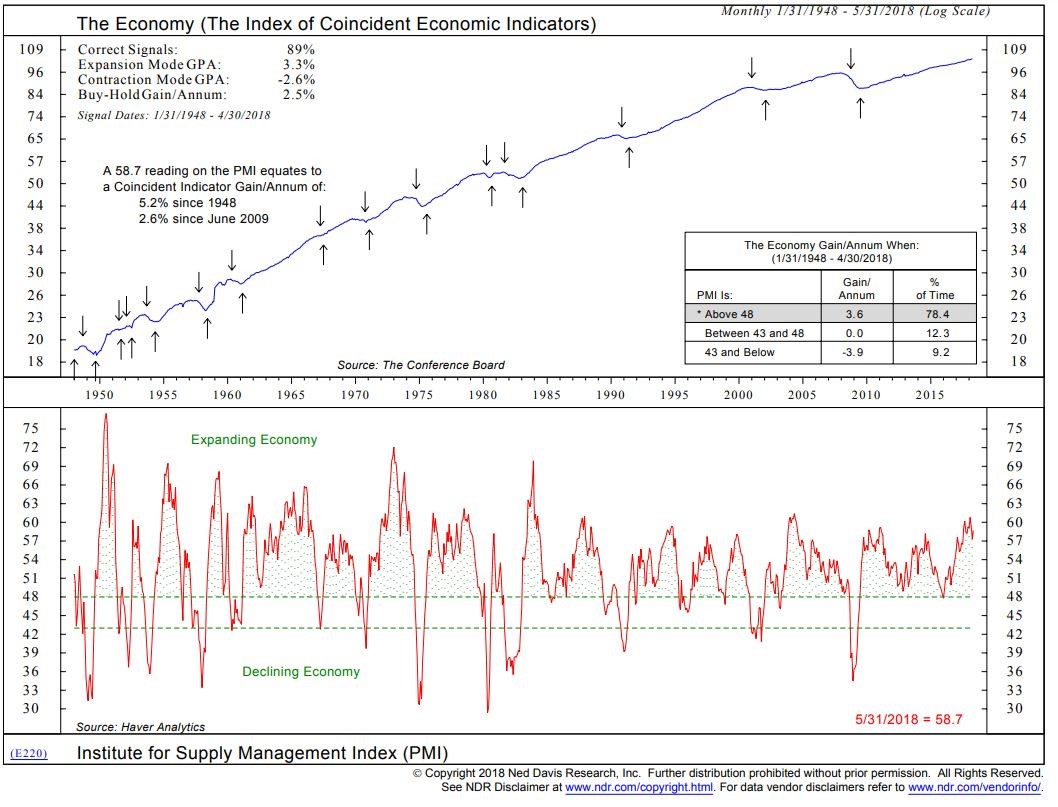
The chart from Ned Davis Research shows the historical results of how well the ISM manufacturing PMI has correlated to economic growth.

Source: Ned Davis Research
The signal for economic growth has been correct 89% of the time. When the PMI has been above 48, economic growth occurred 78.4% of the time. The one slightly negative metric is that the current PMI since June 2009 has been consistent with 2.6% growth. The recent expansion has had lower growth, so that’s why this great report is consistent with only okay growth. According to Renaissance Macro, the two ISM reports are consistent with private domestic demand growth, which is GDP excluding changes to inventories, trade, and government spending, above 5% annually.
Conclusion
The economy is growing robustly as of April and it looks like May will be another strong month based on the soft data like the ISM reports. However, some investors are looking for growth to peak this quarter. We suggested reasons why growth is unsustainable in Q2 and also ways it can pick up in the future. Investors are focused on the rate of change in analysts’ earnings estimates for Q3 which means they are also looking at the economy in Q3.
One fair aspect to question is if the strong Q2 growth was priced in accurately in Q1 given the volatility in that period. It’s possible stocks recover from that correction while watching GDP growth decelerate slightly from Q2. The S&P 500 is one of the few US indexes which actually has room to recover as the tech stocks, small caps, and micro caps have all already hit new record highs.
Have comments? Join the conversation on Twitter.
Disclaimer: The content on this site is for general informational and entertainment purposes only and should not be construed as financial advice. You agree that any decision you make will be based upon an independent investigation by a certified professional. Please read full disclaimer and privacy policy before reading any of our content.


