UPFINA's Mission: The pursuit of truth in finance and economics to form an unbiased view of current events in order to understand human action, its causes and effects. Read about us and our mission here.
Reading Time: 4 minutes
The March Challenger job cut announcements report is supposed to be a leading indicator for the labor market since announcements occur before actions. The report showed there were 222,288 new job cut announcements which was up from February’s 56,660. That’s the highest monthly total since January 2009 which had 241,749 cuts. March had a 267% yearly increase. This report doesn’t include the hundreds of thousands of workers who were furloughed. In Q1, there were 346,863 cuts which was up 82% from last year and the highest quarterly total since Q1 2009.
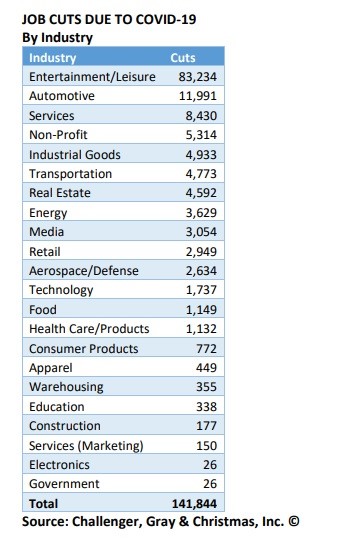
The pandemic caused 141,844 of the cuts in March. The hardest hit industry was entertainment/leisure which had 83,234 cuts as you can see from the table below. Autos had 11,991 cuts and services had 8,430. Services might see more weakness in April because the sector involves human to human contact.
There was a 57.6% increase in cuts in the Eastern region year to date as it had 88,956 cuts in March. New York had 30,873 cuts in March which is higher than the 27,953 cuts in the first 3 months of 2019. The Midwest saw the 2nd biggest spike as there were 37,809 cuts; year to date yearly growth was 116.5%. The West was the worst hit which makes sense because California has been shut down for weeks. Yearly year to date growth in cuts was 117.6% as there were 72,871 cuts in March. Finally, the South was up the least as it has had year to date growth of 41.3% and 22,652 cuts in March.
There also were a lot of hiring announcements because some industries such as groceries and online shopping have seen a big increase in demand. There were 824,610 hires announced. That’s more than the full year of hires announced in 2014 and 2015. COVID-19 caused 821,810 hires. Most of the hires were in retail and transportation which had 462,010 and 302,000. Specifically, Instacart had 300,000 hires, Wal-Mart had 150,000 hires, Amazon had 100,000 hires, and both CVS and Dollar General had 50,000 hires each.
Record Spike In Claims: 9.5% Unemployment?
Once again, we saw stocks rally on the same day a record jobless claims report came out. This signals the weakness is priced in. You can argue it’s good news claims were up because it means people are getting the help from the government they need. We already know demand for unemployment insurance is up; it’s just a matter if people are getting the money. With the extra $600 the federal government is adding to state aid, some are seeing a pay increase. In New York state, from March 23rd to March 28th, there was a 10-fold increase in website visits to 35 million on the Department of Labor’s site. There was a 161-fold increase in phone calls to 8.2 million to the NYS Department of Labor (people likely called multiple times).
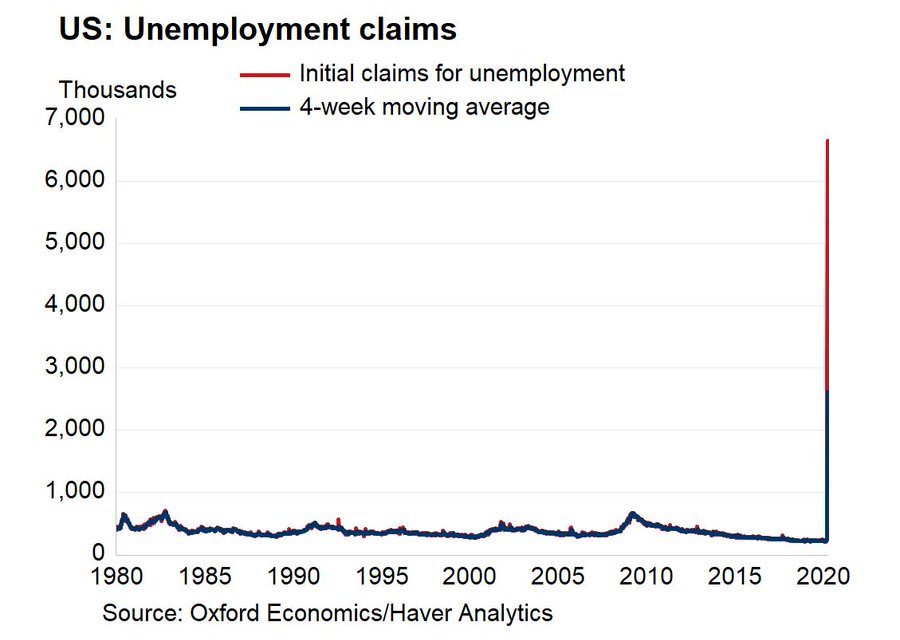
Specifically, claims in the week of March 21st were revised from 3.283 million to 3.307 million. In the week of March 28th, there were 6.648 million claims which beat estimates for 3.35 million. The highest estimate was 6.5 million. As you can see from the chart above, there have been about 10 million claims in 2 weeks. The economy only lost 8.6 million jobs in the entire 2008 financial crisis. In February, there were 5.787 million people unemployed people and the rate as was 3.5%. That number increased 9.955 million in the past 2 weeks which is a 172% jump. If the unemployment rate increases by 172%, it will be at 9.5%. The peak last recession was 10% and the peak since the Great Depression was 10.8% in 1982. It’s notable that the size of the labor force and participation rate won’t stay the same from February (latest data as of the writing of this article) to April. The April report will have a higher than 9.5% unemployment rate because we still have 2 more weeks of data that will go into that report.
Philly Fed Survey Quantifies Recession
The chart below shows the new Philly Fed weekly tracker of new orders and sales for manufacturing and non-manufacturing firms. It’s from the week ending March 29th. As you can see, over 46% of firms have reported decreases in new orders or sales of more than 5%. Over 10% of services firms have had a 60% or more decline in sales or new orders. Almost 30% of services firms have shutdown. The service sector data is downright ugly.
What Can The Fed Do?
The next Fed meeting is April 29th, but the typical Fed schedule has been thrown out the window because the Fed has made intra-meeting decisions in response to the volatility and lack of liquidity caused by the panic related to COVID-19. All eyes are squarely on the COVID-19 data in terms of testing and new cases because the Fed has done its job so far but may have to do more if the dollar continues to rise. The market has calmed down, credit is available, and the muni-bond market has gotten closer to normal.
The fact that the maligned Carnival Corp was able to raise money, shows financing is available. The firm sold $4 billion in secured bonds which was above the $3 billion targeted. The coupon was cut from 12.5% to 11.5%. That’s very high for a BBB rated firm, but it’s to be expected because the company can’t earn money. This debt offering leads to the obvious question. If the cruise companies can raise money, why can’t other firms do so without getting help from the government? The answer is free money will always be taken if offered.
If markets get into trouble, the slide below shows you what the Fed can do to solve the problem. Remember, the Fed never runs out of tools. Buying corporate debt wasn’t thought to be a probable outcome before a few weeks ago.
Conclusion
The labor market is in terrible shape. This was a 2 week spike in initial claims for the ages. It makes every other increase look tiny. In March there was a spike in job cut announcements. There will be even more in April. The Fed has done its job, but has other tools if need be.
Have comments? Join the conversation on Twitter.
Disclaimer: The content on this site is for general informational and entertainment purposes only and should not be construed as financial advice. You agree that any decision you make will be based upon an independent investigation by a certified professional. Please read full disclaimer and privacy policy before reading any of our content.


