UPFINA's Mission: The pursuit of truth in finance and economics to form an unbiased view of current events in order to understand human action, its causes and effects. Read about us and our mission here.
Reading Time: 5 minutes
The US economy has changed since the period leading up to the 2008 financial crisis. There is much to learn about this cycle because it is soon to be the longest since 1854. That means the economy will look much different in the year before the next recession than it did in 2007. To be clear, there are always differences because the cause of each recession is different, but there will be more differences than usual. For context, the first generation iPhone, which had a 2G cellular connection, was released in 2007. The tech giants which make up the largest companies in the world were much smaller then. Therefore, the makeup of the S&P 500 is much different; it’s like right before the tech bubble burst except this time the tech companies are wildly profitable.
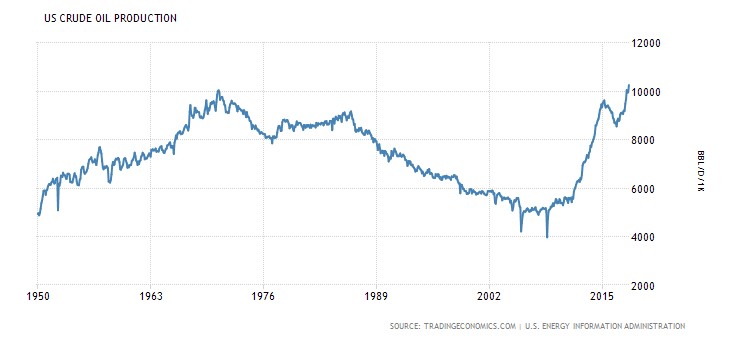
One of the biggest differences in the economy is energy production as fracking was just beginning to be introduced in 2007. As you can see from the trading economic chart below, the US oil production bottomed in the years prior to the 2008 recession. 
Source: Trading Economics
Oil prices rallied sharply in 2007 and 2008 as commodities demand peaked right before the recession. Oil started 2007 at $61.05 and peaked at $147 in July 2008. The energy names were among the hottest stocks in 2008 as the natural gas and oil producers along with the fertilizer stocks led the charge right before the bear market collapse.
Energy Is More Important To America
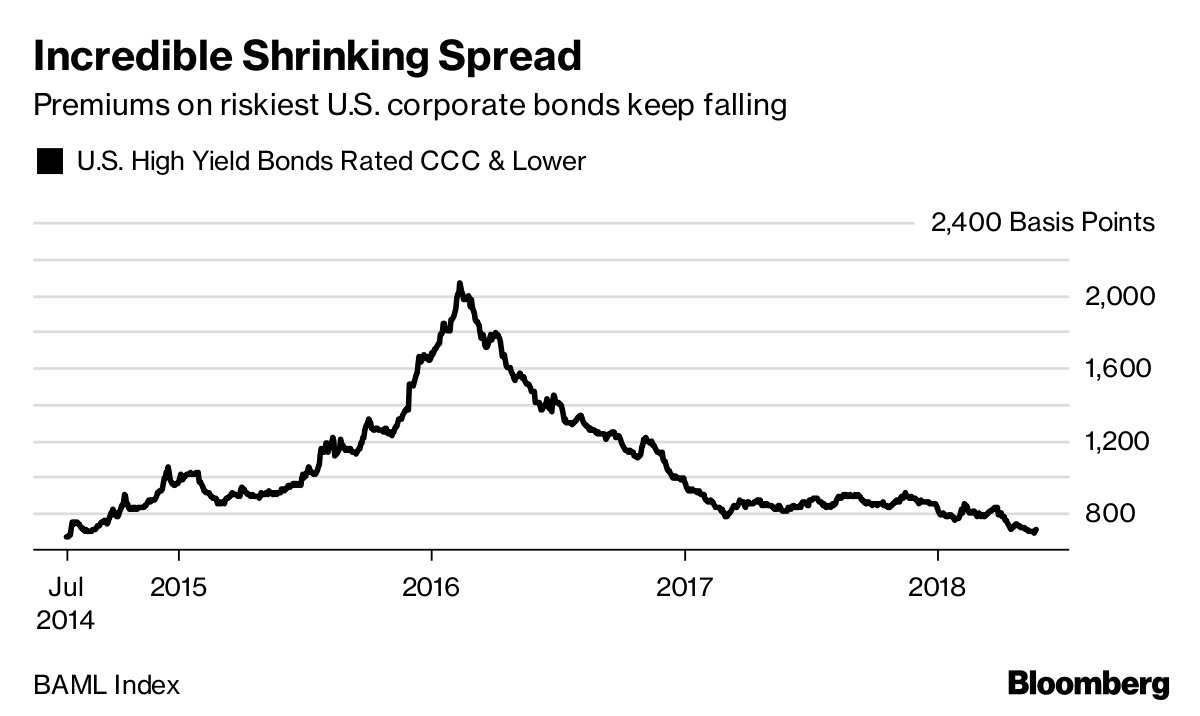
We took a trip down memory lane to understand the current environment as WTI oil has rallied to the low $70s. It is up 43.6% in the past 12 months. If oil were to rally as much as it did in 2007 and 2008, the US economy would outperform the other advanced economies even during a recession because of its increased production. The energy names caused the junk bond market to look terrible in 2016 as they pushed recovery rates to record lows. Now, the reverse is happening as energy is helping the U.S. economy. The JNK, which is a junk bond ETF, fell 23% from the peak in 2014 to the trough in 2016. Since the stock market peak in January, the JNK is only off 3%. As you can see in the Bloomberg chart below, the premiums on junk bonds have fallen this year after peaking in 2016 when oil prices bottomed.

Source: Bloomberg
The strength in energy is leading the charge in the U.S. industrial sector which is doing better than the other advanced economies which aren’t as big energy producers. Spotting the hottest part of the American economy is valuable because the US has been outperforming the other global economies. The latest great industrial production report from April was spurred by energy as utilities were up 6% and mining production was up 10.6% year over year. As you can see, energy is driving the hottest part of the industrial sector.
A firm was quoted in the Kansas City Regional Fed Manufacturing report discussing the impact oil has had on its business. The firm stated, “Our production is on record pace for this year due to increased drilling in the oil and gas industry. The economy is strong in our areas of production but continued rising oil prices will eventually set the industry up for a fall.” The problem with oil is it runs in a boom and bust cycle like many other commodities. Besides the supply and demand dynamics, speculation in futures contracts can cause prices to whipsaw like they did in 2007 and 2008. There were calls to limit such speculation because energy can be considered a national security concern for America. Obviously, the politicians weren’t worried about the speculation in the oil market in 2016, when prices were cratering. Instead they took the credit for declining prices.
44 Month High In Manufacturing
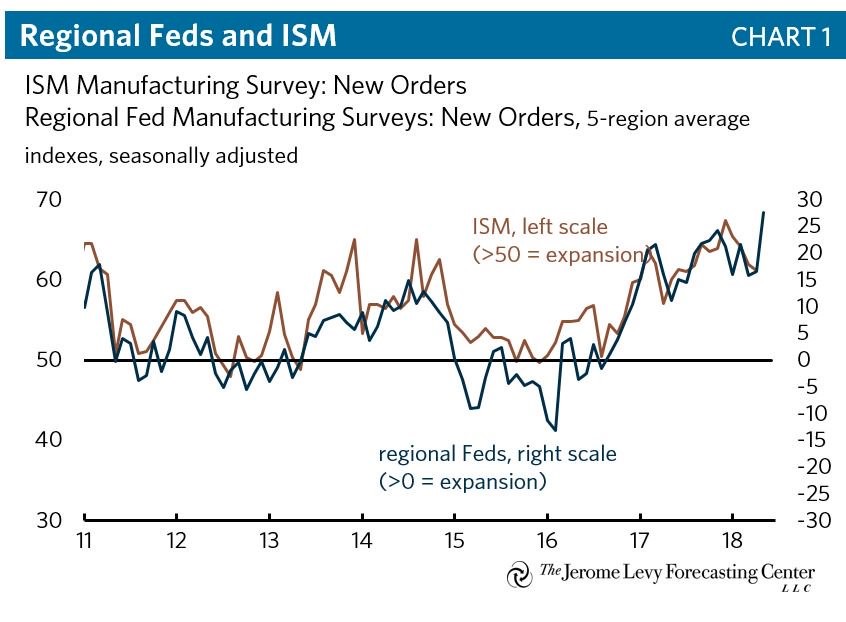
In the industrial production report, manufacturing was only up 1.8% year over year as the traditional driver of industrial production didn’t do so well. The question facing investors now is if that will change in May as the soft data reports are showing signs of improvement. The latest 5 regional Fed manufacturing reports for May all beat estimates and most beat the highest estimate showing the remarkable strength the sector is exhibiting. As you can see from the Jerome Levy Forecasting Center chart below, the new orders index average of the regional Fed reports is predicting that the new orders seen in the May ISM report, which comes out on June 1st, will be outstanding. Furthermore, the Markit PMI composite flash for manufacturing was 56.6 which beat estimates by one tenth and was the best report in 44 months. Manufacturing in America could be headed for a turnaround in the May industrial production report. Even though manufacturing is smaller than the services sector, it’s wild swings play an important part in where the economy is headed.

Source: Jerome Levy Forecasting Center
Expensive Energy Bad For The Consumer
This brings us to our final point about energy’s effect on the economy. The manufacturing sector is doing great, but consumer don’t like high oil prices as it is both a psychological negative sign and added cost that tells consumers to drive less. Consumers have slightly less money in their pockets to spend on retail and restaurants and more importantly, high gas prices cause them to limit their trips to the store. Surprising to some millennials, 90.5% of retail spending is still done in brick and mortar stores, so this is important.
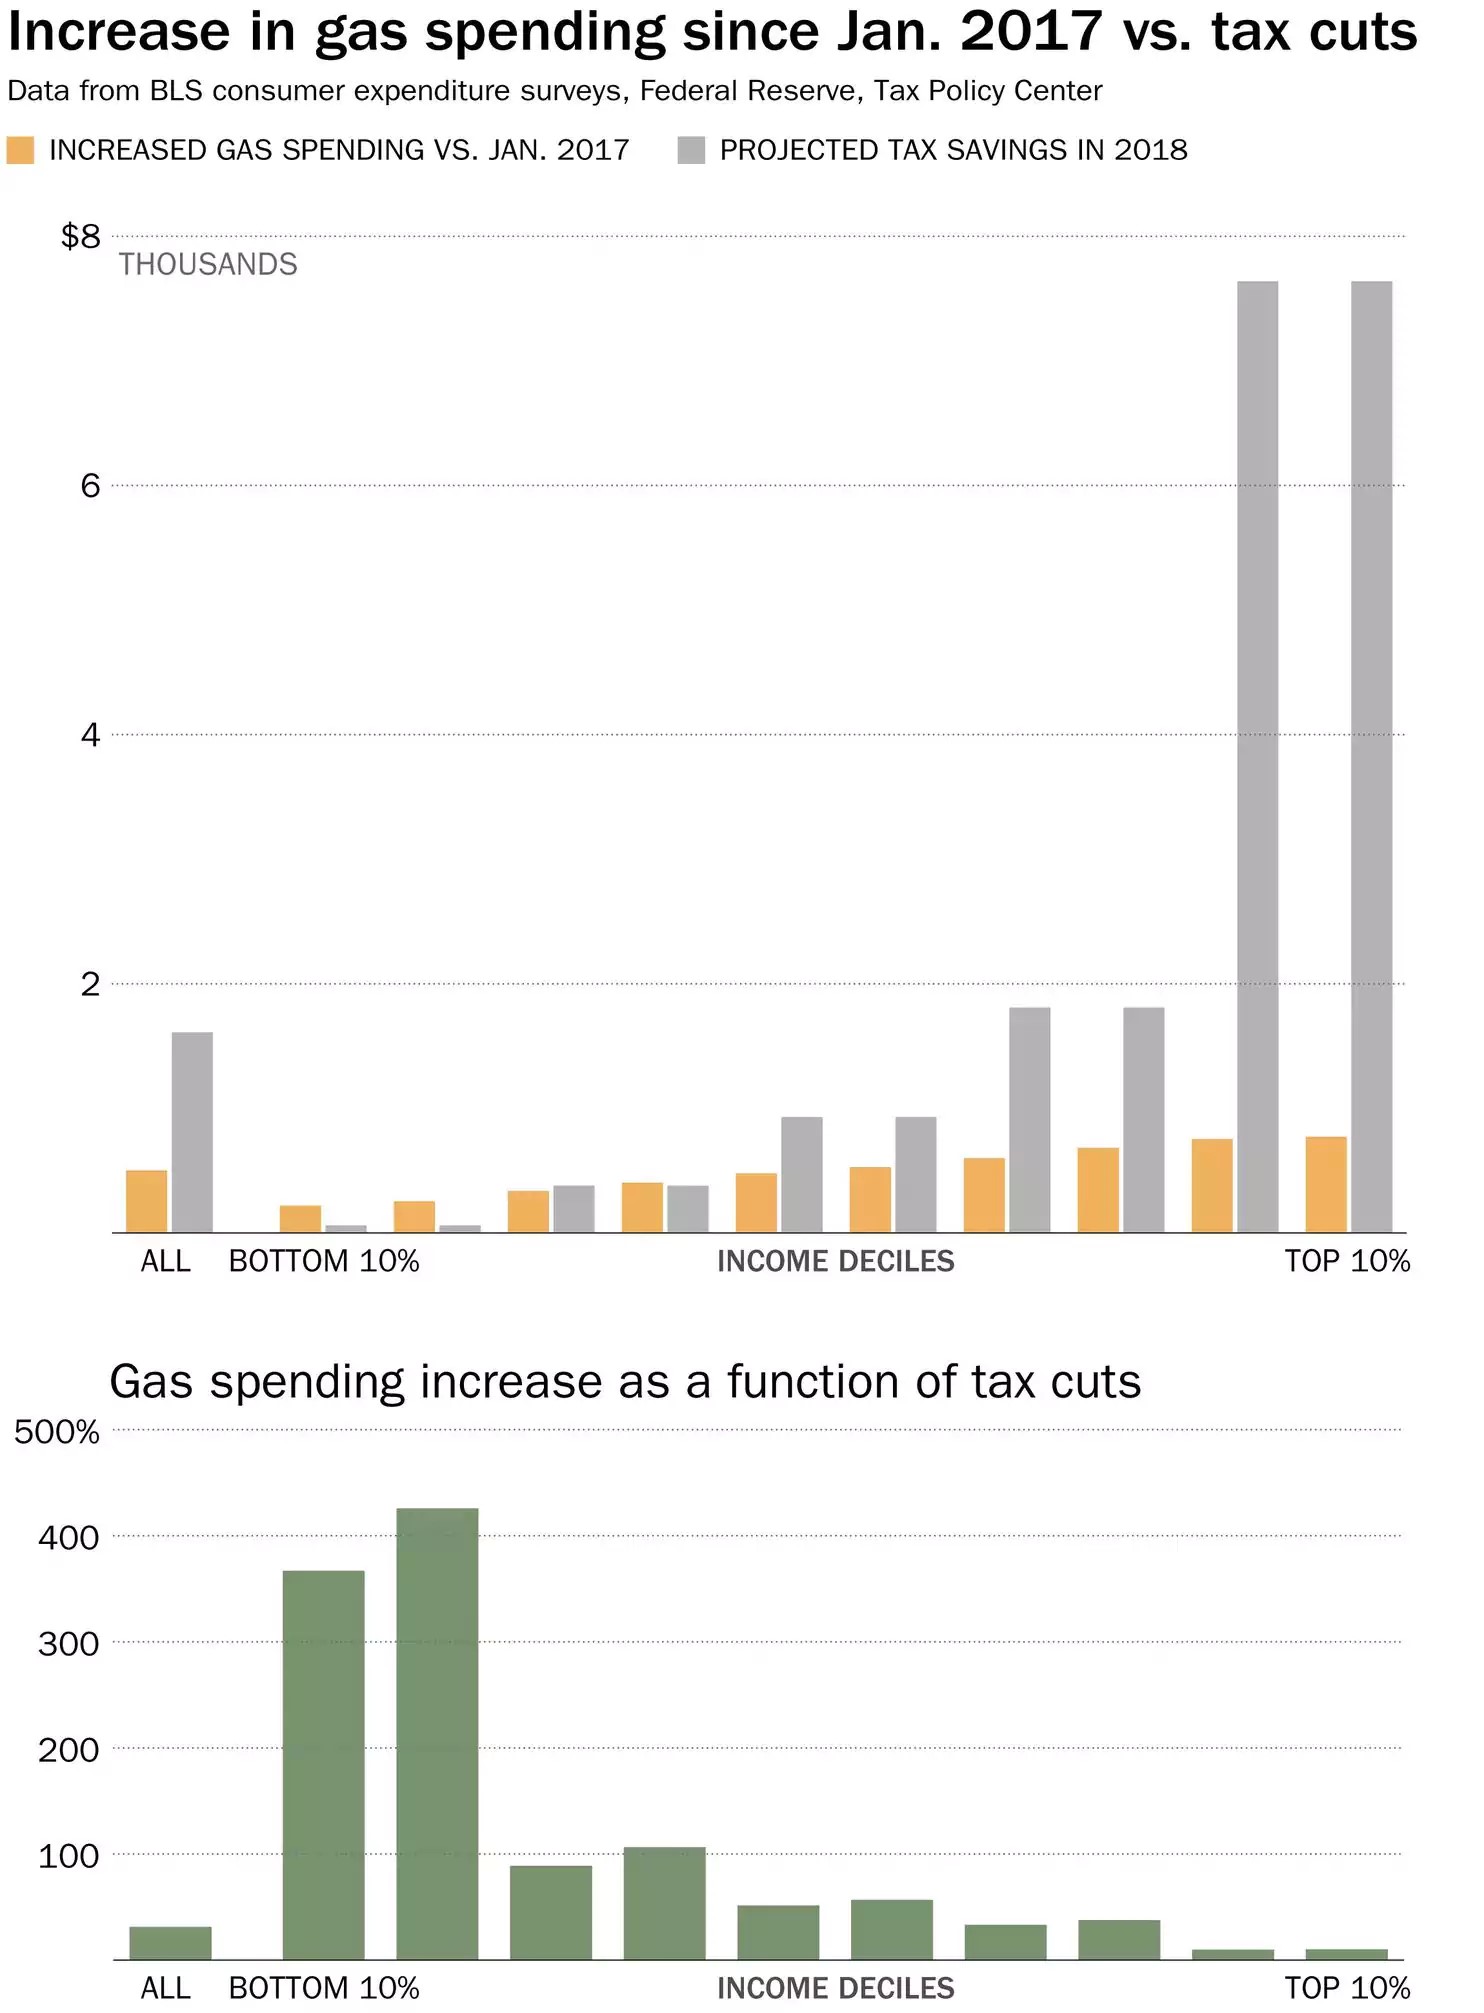
The big political talking point is that rising gas prices are eliminating much of the tax cut gains consumers have received. To be clear, rising prices partially because of OPEC’s cuts aren’t a reason to oppose tax cuts. However, the chart below shows the big negative impact rising gas prices could have. As you can see from the Washington Post chart below, the gas price hikes are more than the savings from the tax cuts for 3 income deciles.

Source: Washington Post
Conclusion
Energy is driving the US industrial sector to outperform other advanced economies. This can be good news in the short term, but if oil spikes for the rest of the year like it did in 2007 and 2008, there will be a negative impact on the consumer. Luckily, this cycle won’t also include a mortgage crisis like 2008 as we have explained previously in our article Housing Market Leverage. Core inflation, which is the Fed’s main concern, won’t be directly impacted by rising oil prices since it’s calculation excludes energy and food costs, but the Fed will surely be watching to see what oil does to the economy and will alter its policy accordingly. Early signs suggest they are not afraid of higher inflation for longer as indicated in their “symmetric” policy approach.
Have comments? Join the conversation on Twitter.
Disclaimer: The content on this site is for general informational and entertainment purposes only and should not be construed as financial advice. You agree that any decision you make will be based upon an independent investigation by a certified professional. Please read full disclaimer and privacy policy before reading any of our content.


