UPFINA's Mission: The pursuit of truth in finance and economics to form an unbiased view of current events in order to understand human action, its causes and effects. Read about us and our mission here.
Reading Time: 5 minutes
In the last week of July/first week of August the S&P 500 fell 3.2% and the Nasdaq fell 3.9% making it the worst week of the year for both indexes. The second week of August (this week) is not looking any better, either. On Thursday morning of last week stocks had recovered their losses related to the Fed’s statement on Wednesday. However, all of those gains were reversed on Friday and Monday after the US raised tariffs on China, which prompted China to stop agriculture purchases from the US, as the trade war accelerates in a negative direction at an exceedingly fast pace.
The chart above breaks down the latest tranche of tariffs. The 10% tariff on $300 billion worth of goods starting on September 1st will be mostly on consumer and capital goods. The August consumer sentiment indexes will take a big hit especially in the expectations category. On Friday, Trump announced an agreement with Europe which will lower trade barriers and get the EU to increase its beef imports from America from $150 million to $420 million. It’s strategic for the US to strengthen its relationship with Europe as the administration put new tariffs on China.
Slight Decline In ISM Manufacturing PMI
Based on the weakness in the global manufacturing PMI (49.3), the modest decline in the ISM manufacturing PMI wasn’t as bad as it could have been. There is weak growth, but no manufacturing recession yet. As you can see from the chart below, the PMI fell from 51.7 to 51.2 in July which missed estimates for 51.9.
42.9 is the overall economy breakeven line. This PMI is consistent with 2.5% GDP growth which is higher than the consensus of 1.9%. However, this was the weakest PMI since August 2016.
The new orders index was up 0.8 to 50.8. That will help the leading indicators index slightly. However, the production and employment indexes fell 3.3 and 2.8 points to 50.8 and 51.7. The prices index supports the Fed’s rate cut as it fell 2.8 points to 45.1. The tariffs are hurting trade as the export orders and imports indexes fell 2.4 and 3 points to 48.1 and 47. Four of the 10 quotes in this report mentioned tariffs. A computer and electronics parts firm stated, “China tariffs continue to be a concern. The uncertainty of future tariffs involving China, Canada, and Mexico is also a concern. China tariffs for electronic parts are averaging 17 percent.” The new tariff announcement should hurt the ISM PMI in August. It could fall below 50 if the tariff isn’t reversed.
Continued Slowdown In The Labor Market
The July labor report showed a continuation of the slowdown in job creation growth. This is probably related to the cyclical slowdown and the fullness of the labor market. The previous 2 months had negative revisions. May decreased from 72,000 to 62,000 jobs created and June decreased from 224,000 to 193,000. These revisions are part of the reason why the chart below shows average monthly job creation in 2019 is only 165,000, which is the weakest since 2010.
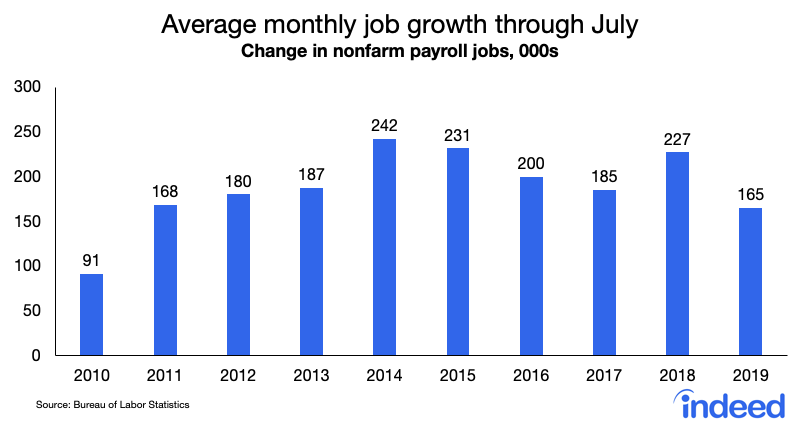
This cyclical slowdown is similar to 2016. Job creation is lower than in that slowdown likely because the labor market is fuller.
Industry By Industry Breakdown Of Labor Market
There were 164,000 jobs created in July which beat estimates for 151,000. That headline number sounds better than it was because the government created 16,000 jobs, likely none of which were related to the 2020 census yet (the federal government added 2,000 jobs). The 148,000 private sector jobs added missed estimates by 12,000. As the chart below shows, educational and health services drove job creation as it added 66,000 jobs. This isn’t a highly cyclical industry group.
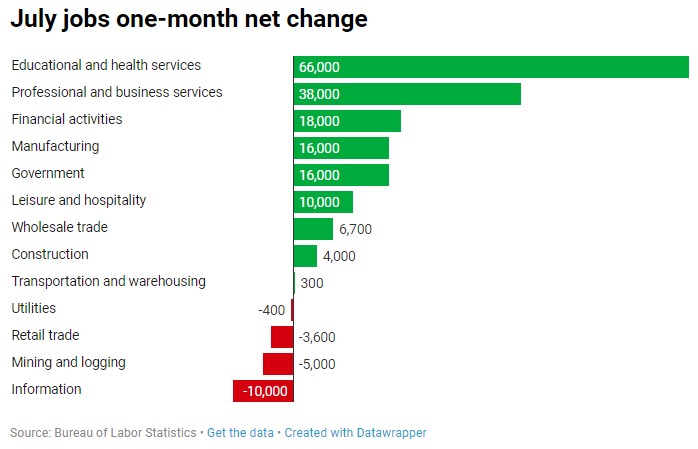
Construction added 6,700 jobs even though the June construction spending report was poor. The good news is the ADP report showed 11,000 small business jobs added which reversed the 2 month trend of job losses.
The manufacturing sector added 16,000 jobs which is different from the 2.8 point decline in the ISM employment index. What’s not different is the length of the manufacturing workweek which fell from 40.7 hours to 40.4 hours. Overtime hours fell from 3.4 hours to 3.2 hours. The next stop after cuts to hours worked is firing workers.
Labor Participation & Wage Growth
The unemployment rate rose from 3.6% to 3.7%. The underemployment rate fell 0.2% to 7% which is the lowest reading since December 2000. The lowest reading on record going back to 1994 is 6.8%. The overall labor force participation rate rose from 62.9% to 63%. However, the prime age participation rate fell from 82.2% to 82% which is the lowest reading since September 2018. The peak of 82.6% in January 2019 might have been the cycle peak.
This was a poor month for weekly earnings growth, but real wage growth could be fine if inflation keeps falling. Hourly wages were up 0.3% monthly which beat estimates for 0.2% growth. Also, June’s growth was revised higher from 0.2% to 0.3%. Yearly growth improved from 3.1% to 3.2% which beat estimates for 3.1%.
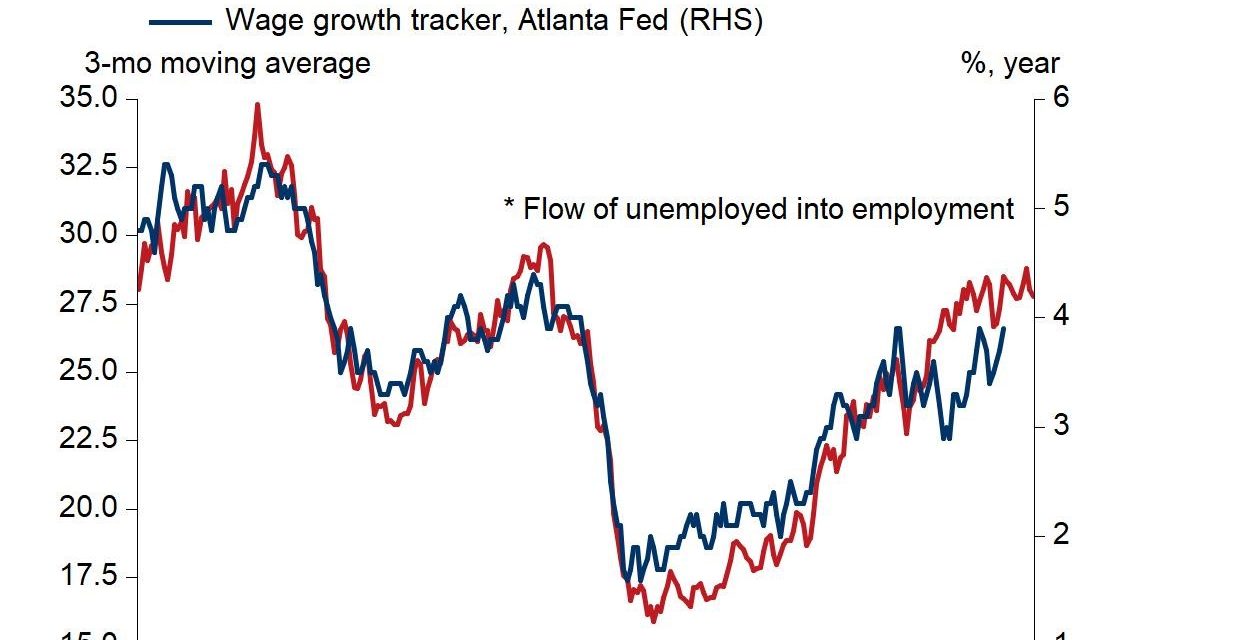
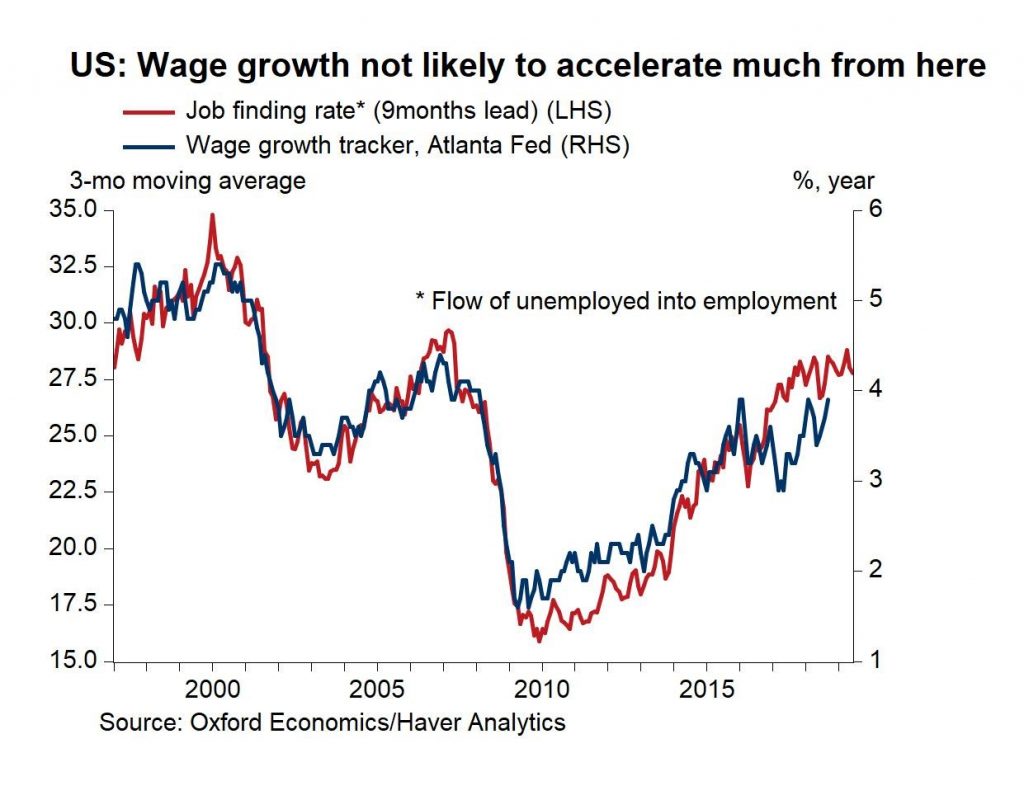
This was a poor month for weekly wage growth because hours worked fell from 34.4 hours to 34.3 hours which missed estimates for no change. This decline caused average weekly wage growth to fall from 2.84% to 2.61%. There would need to be a large decline in inflation to make up for that. Real weekly wage growth likely fell. The cycle peak for average weekly wage growth on a nominal basis was 3.6% in October 2018. The next 3 months will have very tough comparisons, so growth might continue to fall. The chart below supports that narrative as the flow of unemployed to employed implies a plateauing of wage growth.
Conclusion
The new tariff on China will affect mostly capital and consumer goods. It might catalyze negative manufacturing growth since the ISM PMI is barely above 50 as it is. The BLS labor report showed average monthly job creation in 2019 is the weakest since 2010. Follow the intermediate term trend, not the month to month data. Real weekly wage growth was strong in June because nominal weekly wage growth improved slightly, and inflation fell. It’s not the same for July as nominal wage growth fell significantly. The cyclical slowdown is taking its toll on the labor market. There’s no signal of a recession incoming though, right now.
Have comments? Join the conversation on Twitter.
Disclaimer: The content on this site is for general informational and entertainment purposes only and should not be construed as financial advice. You agree that any decision you make will be based upon an independent investigation by a certified professional. Please read full disclaimer and privacy policy before reading any of our content.


