UPFINA's Mission: The pursuit of truth in finance and economics to form an unbiased view of current events in order to understand human action, its causes and effects. Read about us and our mission here.
Reading Time: 5 minutes
One of the top discussion topics on Twitter in our sphere has been Q2 earnings season and the general trajectory of earnings. We are happy to say that investors are following the correct topic as earnings determine valuations. The rate of change of analyst estimates tells you where stocks are going. There tends to be a bias to discuss the negatives, and overlook the positives. Our goal is to review the topic from a balanced perspective.
If earnings season was signalling negativity, the stock market, being a leading indicator, would likely decline. Instead, we have seen it rally to new highs. Let’s review the data to help us understand the likelihood of a stock market decline based on poor earnings.
As we mentioned, the Earnings Scout data shows there is likely to be positive earnings growth in Q2. Specifically, estimates as of June 28th were -0.21%. Since firms usually beat estimates, it’s likely we will see growth. Even in the last recession more than half of companies beat estimates. We’re not suggesting earnings seasons in the last recession were good. They were bad because estimates cratered ahead of time.
So far in Q2, 20 S&P 500 firms have reported earnings. They are listed below.
There was a suggestion on Twitter that these companies may be less significant given the small sample size and because they have an unusual reporting schedule. While these 20 firms are not necessarily indicative of the results we will see from the rest of the companies, given the small sample size, they give us an early idea of whether there is a risk of earnings season being terrible. The point here is these first 20 firms don’t support the narrative that earnings season is going to be terrible. 17 of these firms beat EPS estimates.
As we mentioned, earnings estimates are what is important. They generally fall. It’s about how much they are falling (rate of change). The table shows the changes to each firm’s Q3 earnings estimate. This is better than looking at if the company beat or missed estimates. For example, Micron beat EPS estimates, but it’s Q3 estimates fell 22.03%, meaning these results weren’t good. The average estimate cut is 1.57% for those firms. We will be watching the change in Q3 EPS estimates to measure this earnings season instead of looking at absolute growth.
Consumer Confidence Leading To Spending Growth
The base case scenario is for consumption growth to improve in Q2 while headline GDP growth falls. Many bears pointed out how truly weak Q1 was and many bulls will point out the bounce back in consumption growth. We will point out both situations. The charts below show the Cornerstone Macro Confidence indicator in relation to real consumer spending growth. Q1 spending growth was only 0.9%. Cornerstone Macro’s estimate is for a bounce back to 3.5% growth.
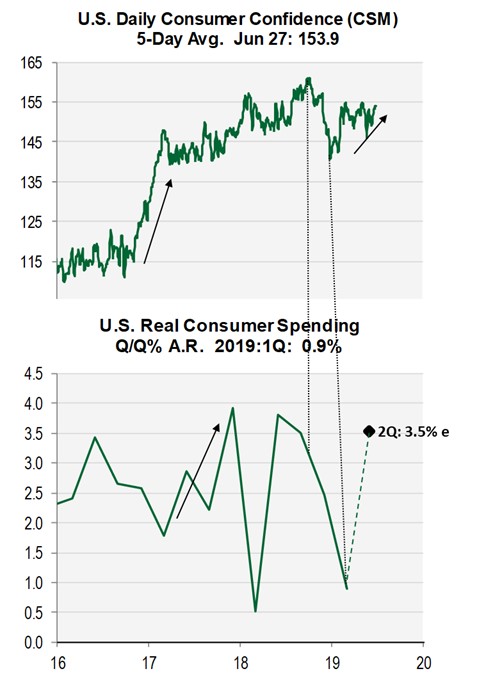
We already reviewed the solid University of Michigan consumer sentiment report and the amazing Bloomberg report. The IBD/TIPP Economic Optimism Index rose 3.4 points to 56.6. The sample period was June 20th to June 27th. That’s the end of the quarter. Optimism may have increased after the stock market rally and the trade deal with Mexico. On a yearly basis, CSM sees 2.6% growth in consumption in Q2 and growth slowing to 2.2% in Q4.
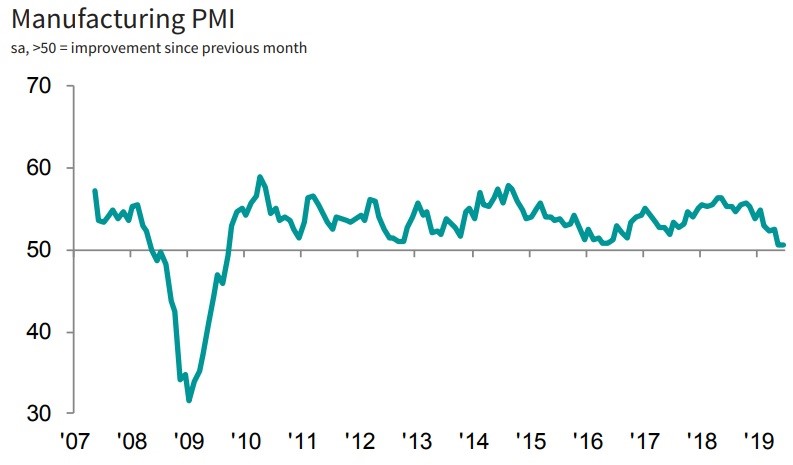
Markit Manufacturing PMI Improves Slightly In Final Reading
The flash Markit composite reading which measures the first 2 weeks of the month was terrible for both the manufacturing and services sectors just like in May. This time the June reading showed a bit of a rebound which goes against the narrative that the economy is cratering. This wasn’t a good report, but the improvement in the 2nd half potentially signals the Mexican trade deal earlier in June helped confidence.
As you can see in the chart below, the June reading was 50.6 and the May PMI was 50.5. The June flash reading was 50.1 which means the reading in the 2nd half had to be 51.1 to move the overall reading up 0.5. The 1 point increase is good to see. The latest ceasefire in tariffs between America and China and the resumption of negotiations might improve the PMI further in July, unless there are other more dominant factors leading to the global cyclical slowdown.
There was improved growth in new business caused by new client gains, however, it was one of the worst readings in 3 years. Very interestingly, the growth rate in international new business was the strongest in 2019 despite the trade war worries. Manufacturing production growth improved, but it was the 2nd slowest growth rate since June 2016. The slowest was in May. Job creation was the lowest since August 2016. Output and input inflation were weak and pre-production inventories fell at the fastest rate since the beginning of 2014.
Even though the Markit PMI was above 50, this reading is consistent with a 0.7% quarterly decline in manufacturing output and an 18,000 decline in manufacturing payrolls. Finally, it’s notable that the US PMI was one of the highest in the world as the global manufacturing PMI was only 49.4.
Similar Weakness In ISM PMI
The ISM manufacturing PMI was very similar to the Markit reading in that it was the lowest PMI since October 2016 and was way below the 1 year average of 56, but beat estimates. It was 51.7 which was down from 52.1, but above estimates for 51.1. As you can see from the chart below, the new orders index fell 2.7 points to 50 which is the weakest reading since August 2016.
The production index actually increased 2.8 points to 54.1. The nominal ISM PMI cratered because the prices index fell 5.3 points to 47.9. The inventories index fell 1.8 points to 49.1. The difference between new orders and the inventories spread (PMI minus inventories) signals the worst weakness since the last recession is coming. This indicator leads the composite by 3-6 months.
Even though the PMI was weak, it’s consistent with 2.7% GDP growth which is above the median estimate for 1.8%. That just shows how optimistic the PMI has been in recent quarters. As we mentioned, the tariffs suppressed both PMIs. 6 of 10 ISM comments mentioned tariffs. The good news is the Mexican tariffs are gone. That will help the computer & electronic parts firm that stated, “China tariffs and pending Mexico tariffs are wreaking havoc with supply chains and costs.”
Conclusion
Earnings season isn’t on pace to be a disaster. The first 20 firms, while a small sample size, are bellwether firms like Costco, which give us a glimpse into the earnings season that follows, suggesting that it wont be as bad as some investors anticipate. The rebound in the CSM consumer confidence index signals improvement in consumption growth in Q2 as compared to Q1. The Markit and ISM manufacturing reports weren’t as bad as some expected, but they showed continued weakness. The latest trade news might help them in July. We will see the July Markit flash reading in about 2 weeks.
Have comments? Join the conversation on Twitter.
Disclaimer: The content on this site is for general informational and entertainment purposes only and should not be construed as financial advice. You agree that any decision you make will be based upon an independent investigation by a certified professional. Please read full disclaimer and privacy policy before reading any of our content.


