UPFINA's Mission: The pursuit of truth in finance and economics to form an unbiased view of current events in order to understand human action, its causes and effects. Read about us and our mission here.
Reading Time: 4 minutes
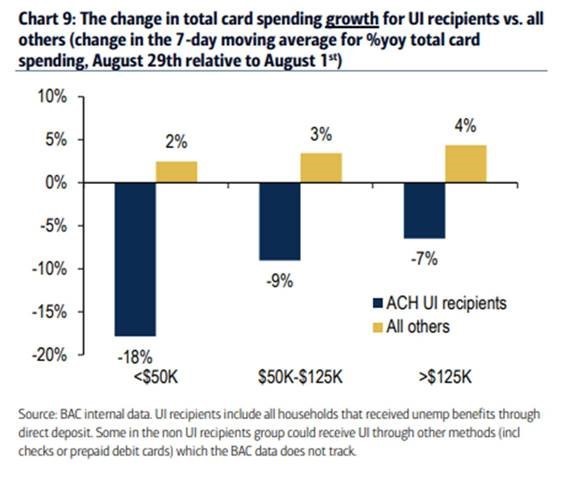
We are getting more details on how the consumer was impacted by the decline in unemployment benefits via non-traditional data points. Normally, waiting until the retail sales report comes out isn’t an issue, but conditions have changed rapidly this year. It’s no surprise that consumers receiving benefits who didn’t get a job were hit hard. The good news is more people got jobs and the people who aren’t on benefits increased their spending. Job growth will need to stay strong to help the people who were laid off now that benefits were lowered.
As you can see from the chart above, those receiving unemployment benefits making under $50,000 per year lowered their card spending growth from the first week of August to the last week of August by 18%, while those not on benefits increased spending growth by 2% which is basically in line with the other income groups. An 18% decline in spending growth is a devastating scenario for this income group because a lot of their spending is non-discretionary.
A big chunk of this group likely works in the leisure and hospitality industry which has suffered the worst job losses due to COVID-19. Even with cases and deaths declining, spending on travel and nights out have been reduced. Reed Hastings, the CEO of Netflix, stated he wants a vaccine before employees go back to work. That’s likely the same line thinking other managers have for travel.
The chart below shows spending growth for the third week of August compared to January. As you can see, low income spending growth is 1.1% and middle income growth is -1.9%. High income growth is -7.9% because of the limitation on certain discretionary items. We aren’t worried about this group. Their spending will improve once the economy opens up.
How Bad Will It Get?
Some economists believe looking at the 3rd and 4th week of August doesn’t leave enough room for the decline in weekly unemployment benefits to impact the consumer. We strongly disagree because during those weeks most people weren’t getting the extra $300 to $400 in weekly benefits. As September moves along, more states will give those smaller benefits out. Furthermore, more jobs are being created each week as the economy gets back to normal and COVID-19 deaths fall. To be clear, the people who don’t get their jobs back will be hurting more each week. It’s just that overall data will be ok because there will be fewer unemployed people as jobs come back.
A consequence of these job losses and the decline in benefits is the increased share of young people living at home. As you can see from the chart below, 52% of young adults live with their parents which is a record high going back to 1900. It’s up 5 points from February. Some of this jump might be temporary as college students are studying at home rather than living near school because of the virus. The inability to meet in person at work hurts young professions in particular because they are still building their network. That’s different from more experienced professionals who can easily activate their network via teleconferencing.
Positive For Small Caps
Prices drive sentiment. Narrative are written around prices. As an investor, you need to figure out which argument justifies the price action and which argument accurately portrays the future. Since small caps have underperformed large caps, the positive narratives on large caps versus small caps are prevalent. However, as you can see from the chart below, the earnings revision ratio for small caps hit a record high. One of the reasons small caps receive criticism is that there aren’t many tech stocks in this group. Tech companies have done so well, they have jumped out of this grouping. The supreme performance of tech/disruptive companies isn’t new this year. Instead, it has gone parabolic this year.
High VIX Could Be A Problem
Sometimes the VIX is correlated with the market in the short term, which isn’t a big deal. The situation from a few days ago is different because the VIX hit a record high if you only look at the points where the S&P 500 was at a record. As you can see from the chart below, the data skips from 2000 to 2007 and then from 2007 to 2013 because there were no records in those periods. The VIX averages 15 when the market is at a record. It recently was in the mid to high 20s with the market at a record which is higher than the peak in 1999.
Investors anticipate volatility. Volatility has briefly come in the past few days. It’s a fool’s game to try to predict if that will continue. However, if you take a step back and look at the long term, this could signal the end of the bull cycle. We’ve previously discussed that the kink in the VIX futures curve is higher than prior to any election. It’s possible the election is only part of the reason some investors are fearful of a correction. The other aspect might be the excess speculation in the growth stocks.
Some make argument that stocks can’t plummet because the bull market is young. That’s the same faulty argument (in reverse) that those calling for a recession made starting when the last expansion reached 7 years old. They said the expansion had to end because it was old. They ended up being wrong for 3 years. It took a rare pandemic to finally cause a recession. Time is not linear. Sometimes a lot of action happens in a short period and other times nothing happens for years.
Conclusion
If the labor market keeps improving, the consumer will be fine. In September, more people will get the $300 to $400 in weekly unemployment benefits and more people will have jobs. For those without jobs, it will be very tough. It will be interesting to see if the spike in young adults living at home stays the same after the pandemic. Some thought the percentage would fall sharply after the global financial crisis, but it didn’t. Small caps have had a record high earnings revision ratio. The VIX recently hit a record high for the stock market being at a record.
Have comments? Join the conversation on Twitter.
Disclaimer: The content on this site is for general informational and entertainment purposes only and should not be construed as financial advice. You agree that any decision you make will be based upon an independent investigation by a certified professional. Please read full disclaimer and privacy policy before reading any of our content.


