UPFINA's Mission: The pursuit of truth in finance and economics to form an unbiased view of current events in order to understand human action, its causes and effects. Read about us and our mission here.
Reading Time: 4 minutes
During economic slowdowns like the one the US economy has been in since Q4 2018, investors try to figure out if it will transition into a recession or end quickly. The estimates for Q1 GDP aren’t as horrible as some traders feared when stocks were crashing late last year. The median estimate is for 1.6% growth. The Atlanta Fed, NY Fed, and St. Louis Fed Nowcasts call for 2.3%, 1.4%, and 2.2% growth, respectively. The Q2 NY Fed Nowcast has growth improving to 2.04%.
Stock prices aim to reflect future changes to earnings. Sometimes they don’t accurately reflect future earnings; that is where alpha is generated. The ECRI leading index is supposed to project how the economy will do 2-3 quarters in advance. As you can see from the chart below, the growth rate almost hit recessionary levels at the start of this year. This implies economic weakness in Q2 and Q3 of this year.
So far, the NY Fed’s Q2 Nowcast doesn’t show weakness, but we will see what happens. It’s certainly possible that the manufacturing slowdown gets worse. However, it’s also possible that the housing market drives up GDP growth because the decline in interest rates has sparked demand.
The latest ECRI coincident indicator from February shows yearly growth of 2.2%. That’s down from 3% in December. It’s likely going to fall further in March since the leading index was weak earlier this year. The coincident indicator’s growth rate bottomed at about 1% in the summer of 2016. We can use that trough to determine how bad this slowdown is. The chart above shows in the week of April 5th, the yearly growth rate improved 1.1 points to 0.2%. It has finally gone positive after predicting weakness for the past few months.
Bearish Investors Aren’t Satisfied
The controversy over this improvement is that it is partially being driven by the stock market. The bearish investors obviously don’t agree with the stock market’s rally which is why some aren’t on board with the index’s improvement. This index is proprietary, so we can’t pick apart each contributing factor to see if we agree with it. ECRI, the company, uses this leading index along with other private indicators that subscribers pay for to come up with their assessment of the economy.
So far, ECRI hasn’t backed down from their slowdown call which gives credence to the bears’ point. Regardless of whether the slowdown ends soon, it doesn’t look like it will end in a recession based on this leading index. The Conference Board’s leading index likely will improve when the next report comes out because jobless claims fell to 196,000, which is the lowest level since 1969, and the stock market has rallied sharply.
Q1 Earnings Scorecard
The Q1 earnings scorecard gives us our first look at Q1 results thus far. EPS estimates have been beaten soundly, but revenues barely beat estimates. That’s likely because EPS estimates were low and revenue estimates were high. According to FactSet, Q1 EPS will fall 4.3% and revenues will rise 4.8%. To be clear, that’s a blended estimate which means it includes the few firms which have reported results and the estimates for the others. Margins will fall this quarter partially because of increasing labor costs.
The table below compares Q1 earnings as of April 12th with other quarters at this point in earnings season. To be clear, this only includes reported results not estimates.
The first 29 S&P 500 firms had EPS growth of 5.16% because the average EPS surprise was 7.19%. The bottom info in the chart shows this is much higher than the 3 year average surprise of 3.58%. 83% of firms beat estimates which is 6 points above average.
On the other hand, revenue growth was 4.33%, but the average sales surprise was only 0.65%. 52% of firms beat sales estimates which is below the 3 year average of 69%. Sales are always beaten at a lower rate, but this time the difference is much larger than usual. These companies are seeing higher EPS growth than revenue growth, but the results will probably switch after the rest of the firms report earnings. The Earnings Scout data and FactSet data don’t match perfectly, but the trends are similar. We like to look at all available data to avoid relying on one provider.
Excuses Firms Have Made In Q1
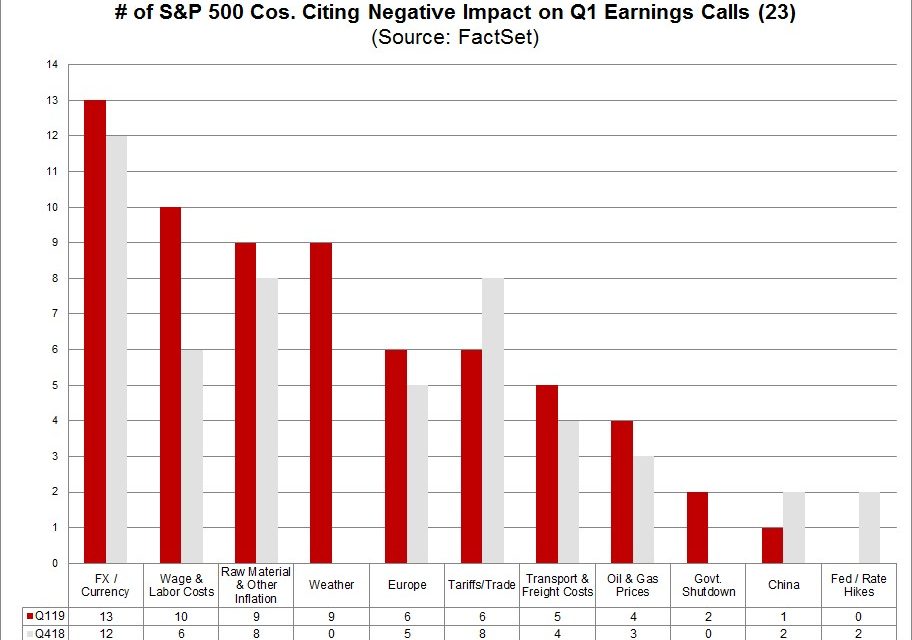
The chart below shows the top excuses mentioned on the 23 earnings calls that have occurred at this point in the quarter.

The number of firms mentioning currency issues led the list of excuses just like Q1. Wage and labor costs as well as the weather were much more of an issue in Q1 than Q4. Remember, these are the same firms reporting earnings in the beginning of the quarter. In these industries, there must be labor constraints. That’s consistent with the low unemployment rate and high average hourly earnings growth. Tariffs/trade were mentioned less often probably because media headlines are suggesting that America and China are near a trade deal (whether accurate or not we don’t know).
India To Drive Global Economy
China’s exports in March came above estimates as growth was 14.2% which beat estimates for 7.3%. However, imports fell 7.6% instead of 1.3%. This big divergence caused the trade surplus to be $32.64 billion instead of $6 billion. The Chinese stimulus is working to promote growth. The trade deal, if enacted, could further this growth later this year. The IMF raised its estimate for 2019 GDP growth to 6.3% from 6.2%.
In the short run, China could be rebounding slightly, but in the long run growth is slowing as the country faces issues with transitioning into a service based economy instead of one based on exports. China wants to build up its middle class rather than being the home of cheap labor. As you can see from the table below from 2019-2020, China will contribute an enormous 30.9% to global growth because of its size and high growth rate.
Over the next decade, the torch should be passed from China to India. The table shows India is expected to grow GDP at the 4th highest rate as it could be 7.7% from 2019 to 2020.
India is growing faster than China, but doesn’t have the size yet. This will change as India has much better demographics than China. China’s median age is 37.3 and India’s is 27. As you can see from the chart below, from 2018 to 2050, India’s working age population will increase by over 200 million and China’s will fall by over 200 million.
India’s population is expected to exceed China’s by 2024. We must pay closer attention to India’s economy and political system because it should drive global growth in the next decade.
Have comments? Join the conversation on Twitter.
Disclaimer: The content on this site is for general informational and entertainment purposes only and should not be construed as financial advice. You agree that any decision you make will be based upon an independent investigation by a certified professional. Please read full disclaimer and privacy policy before reading any of our content.


