UPFINA's Mission: The pursuit of truth in finance and economics to form an unbiased view of current events in order to understand human action, its causes and effects. Read about us and our mission here.
Reading Time: 5 minutes
We headed into the January retail sales report expecting a solid number because consumer confidence was strong. In fact, on Friday, the February University of Michigan consumer sentiment report showed sentiment was close to its cycle high. However, the retail sales report showed little change in the 2 year growth stack and control group sales growth was revised lower and missed estimates.
There’s no evidence of a recession coming, but without a very strong consumer, Q1 GDP growth could be weak because of the negative impact of the coronavirus and the trend of weakness in business investment. The economy should have been coming out of its slowdown in Q1, but that might be delayed by a quarter. Due mostly to the impact of the industrial production report, the NY Fed lowered its Q1 GDP Nowcast from 1.67% to 1.39%. We view the retail sales report not significantly boosting the Nowcast as a negative though because the consumer needs to pick up the slack in the quarter. Due to Friday’s economic reports, Goldman lowered its Q1 GDP tracking estimate by 0.3% to 1.4%.
The Control Group Was Weak
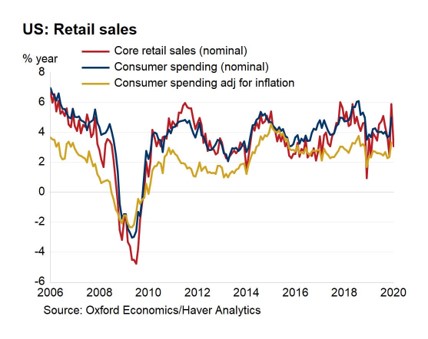
The all-important, control group had a weak report. Monthly growth in December was revised down from 0.5% to 0.3% and growth in January was 0% which missed estimates by 0.3%. It’s not good when the comp gets revised lower and results still miss that lowered bar. The chart below shows the sequential weakness in nominal core yearly retail sales growth.
Yearly advanced retail sales growth fell from 5.5% to 4.4%, but the comp rose from 1.6% to 2.7%. That means the 2 year growth stack fell 0.1%. Yearly growth excluding food services fell from 5.4% to 4%; the comp rose from 1.2% to 2.6%. The 2 year growth stack had no change. Finally, real retail sales growth fell from 3.2% to 1.8%. The growth stack improved because the comp rose from -0.4% to 1.6%. The 2 year growth stack was up 0.6%. At first glance, it looks like this was a weak report because yearly growth fell, but the comps make it look a little better.
Restaurants & Bars Take Share
Yearly growth in the control group fell from 5.94% to 3%. Yearly motor vehicles and parts sales growth improved from 3.54% to 5.72% and monthly growth rose from -1.51% to 0.17%. That strength in yearly growth might not continue as the auto loan delinquency rate is high. Last month, motor vehicles and parts tanked the report. It prevented it from being great. Remember, this is the largest category in the report as it has a 20.1% weighting. This report would have been great if it wasn’t for weak yearly growth in online sales which has a 12.55% weighting. Monthly non-store sales growth rose from 0.17% to 0.29%, but yearly growth fell from 18.25% to 8.39%.
As you can see from the chart below, bars and restaurants are taking share from food and beverage stores.
Remember from the CPI report, food away from home inflation was 3.1% and food at home inflation was 0.7%. This isn’t great for consumers with this trend in spending share in place. Keep in mind, food away from home inflation is way more consistent as food at home inflation responds more to changes in commodities prices.
Since America is over-retailed in terms of square footage per capita versus other nations and sales are shifting online, restaurants are candidates to fill this empty space. Restaurants anchor malls; malls try to bring in traffic with experiences. Food and beverage stores’ yearly sales growth fell from 3.81% to 2.35%, while food services and drinking stores saw an increase in yearly growth from 6.08% to 7.37%. The stereotype about millennials is they like experiences over material possessions. According to Harris Group, 72% of millennials would rather spend money on experiences than material possessions. That could be behind bars and restaurants’ market share gains since 2000.
Solid Industrial Production Report
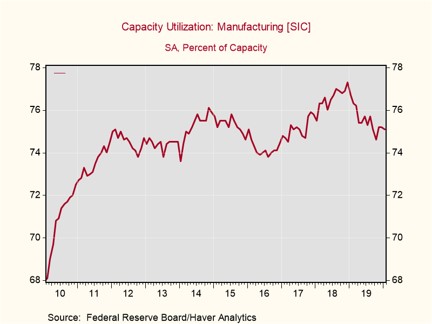
Even though the January industrial production report hurt the NY Fed’s Nowcast by 33 basis points, it wasn’t a bad report. It wasn’t as great as the regional Fed reports showed (all 5 improved and some spiked), but the 2 year growth stack in manufacturing production went up. Industrial production was hurt by the 737 Max’s delay and the warm weather which lowered utilities production. The capacity to utilization rate fell from 77.1% to 76.8% in January.
Monthly manufacturing growth was -0.1%; it was 0.3% excluding aircraft production. If the 737 Max goes into production later this year, manufacturing growth will pick up, but we wouldn’t advise relying on this to formulate a cyclical bull thesis. Mining production was up 1.2% monthly even though oil prices fell. Utilities production fell 4% because it was a warm month again. Yearly utilities production growth fell from -1.5% to -6.2%. Yearly industrial production growth improved from -0.7% to -0.8%, while the comp was about 0.2% easier (2 year stack fell about a tenth). The comp will fall from 3.6% to 2.7% in February which means growth might be positive in the next report.
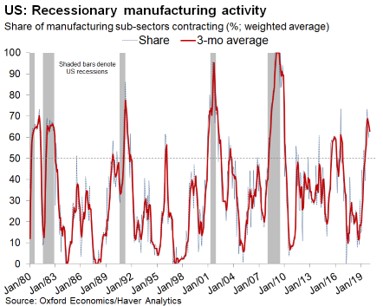
As you can see from the chart below, the weighted average share of manufacturing sub-sectors contracting increased, while the 3 month moving average fell. This industrial production slowdown hit manufacturing significantly as you can see from the chart above.
Industrial production isn’t down nearly as much because mining production hasn’t cratered. There was a mini-fracking bubble that burst from 2014 to 2016. Yearly manufacturing growth rose from -1.2% to -0.7%, while the comp only got easier by 0.2% (2 year growth stack up 0.3%). Yearly growth might be positive next month as the comp goes from 2.7% to 1.1%. The cycle low was -1.5% yearly manufacturing growth in October which is above the bottom of -2.1% in November 2015.
Conclusion
The net result of the retail sales and industrial reports is falling Q1 GDP growth estimates. Both reports were more of the same in a sense because the consumer kept on chugging along and the manufacturing sector is still in a slowdown. Elaborating on that, the consumer will not drag Q1 GDP growth to a strong print if February and March are the same as January. It seems like the days of negative yearly manufacturing and industrial production growth are numbered.
Have comments? Join the conversation on Twitter.
Disclaimer: The content on this site is for general informational and entertainment purposes only and should not be construed as financial advice. You agree that any decision you make will be based upon an independent investigation by a certified professional. Please read full disclaimer and privacy policy before reading any of our content.


