UPFINA's Mission: The pursuit of truth in finance and economics to form an unbiased view of current events in order to understand human action, its causes and effects. Read about us and our mission here.
Reading Time: 5 minutes
Both the ISM manufacturing and services PMIs were strong. In fact, they were stronger than their headlines indicated because of the negative impact from inventories/supplier deliveries. This is the exact opposite factor in the recession. We saw the supplier deliveries index spike in the recession which boosted the PMI even though this was a negative factor (it’s tougher to make on time deliveries in a pandemic). Maybe the PMI should be recalibrated.
Specifically, in the July manufacturing report, new orders jumped 5.1 points to 61.5 and production jumped to 62.1. Even with those strong readings, the PMI was only up 1.6 to 54.2. The inventories index fell 3.5 to 47. As you can see from the chart below, the percentage of firms saying inventories are too low is much higher than those saying inventories are too high. This is an early cycle reading similar to 2010. Production needs to increase to keep up with demand. 13 manufacturing industries reported growth in new orders and 2 reported a decline.
You expect the manufacturing sector to do well because it typically quickly bounces back from recessions. Also, due to social distancing, growth in spending on goods is far exceeding spending growth on services. Even so, the services PMI rose and was higher than the manufacturing PMI. In increased from 57.1 to 58.1 which beat the consensus of 55 and the highest estimate which was 57.5. Most economists called for a decline in the PMI which would have made sense because it seemed like the spike in COVID-19 cases (which is now abating) hurt the services sector.
The business activity index rose 1.2 to 67.2 and the new orders index rose 6.1 to 67.7. Supplier deliveries and inventories fell 2.3 and 8.7 to 55.2 and 52. It’s a good thing to see inventories increase at a much lesser rate while demand increases. The employment index fell 1 point to 42.1. This is in line with the weakness in the household pulse survey. Just like how production in manufacturing needs to increase to keep up with demand, services firms should hire more people to keep up with the improvement in orders. This should give us confidence consumer spending growth and the labor market will rebound after a weak July.
Huge ADP Miss
We’ve been suggesting a weak July BLS report might be coming this Friday. For some reason, the consensus is for 2 million jobs created. The lowest estimate is 350,000 jobs added. In fact, the consensus is anticipating public sector job losses as the consensus is for 2.175 million private sector jobs added. Economists expect the unemployment rate to fall from 11.1% to 10.5%.
There is a massive difference between the consensus and the ADP report. As you can see from the chart below, private sector payrolls fell from 4.314 million to 167,000 which missed estimates for 1.888 million. The lowest estimate for 750,000 was missed. On the one hand, you can say this helps investors brace for a weak BLS report. However, the stock market rose on Wednesday, so there wasn’t any nervousness. There is extreme speculation in markets as the Nasdaq was on a 6 day winning streak and gold was up in 12 of 13 days for the first time ever (as of Wednesday’s close).
There were 63,000 jobs added in small firms, 25,000 jobs lost by mid-sized firms, and 129,000 jobs added by large firms. The goods producing sector added 1,000 jobs and service providing added 166,000. Even though that looks lopsided, it’s the service sector that likely missed estimates the most. The strongest industry was professional and business which added 58,000 jobs. It’s a well-paying cyclical industry, so this is important.
The education and healthcare industry added 46,000 jobs. Healthcare will add more jobs as people get back to having elective surgeries. This pandemic caused a massive swoon in the cash flows of hospitals as elective surgeries were postponed to avoid spreading the virus. This was a temporary boon for health insurers, but there are laws that say how much care they need to provide customers, so they didn’t just pocket that money.
Large Cap Growth Bubble Knows No Bounds
The Nasdaq 100’s 20 day moving average has increased 82 straight days which is the 3rd longest streak ever. The longest ended before the COVID-19 crash. It was 89 days. No streak in the 1990s got this long. The FAAMNG stocks are now larger than the materials, energy, financial, and industrial sectors. When you start seeing companies expand beyond bounds that make any sense, it’s a sign of a bubble. The fact that GM is considering spinning off its EV business is another sign of a bubble. In 1998, Barnes and Noble announced it would spin off its online business. Companies want to take advantage of the euphoria anyway they can.
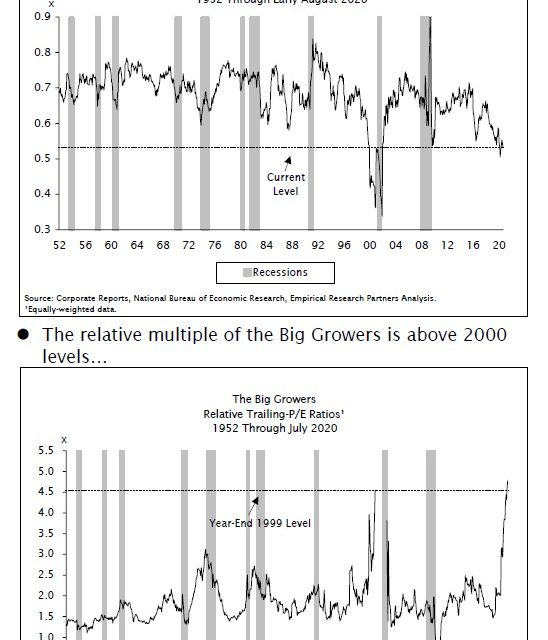
As you can see from the bottom chart below, large cap growth stocks’ relative trailing PE ratios have surpassed the end of 1999 peak. It’s not fair to say stocks should get unlimited valuations because interest rates are low. If that was the case, value stocks would get some capital. After all, they have higher dividend yields than the 10 year yield. The top chart shows the relative multiple of large cap value stocks is the lowest outside the late 1990s and early 2000s.
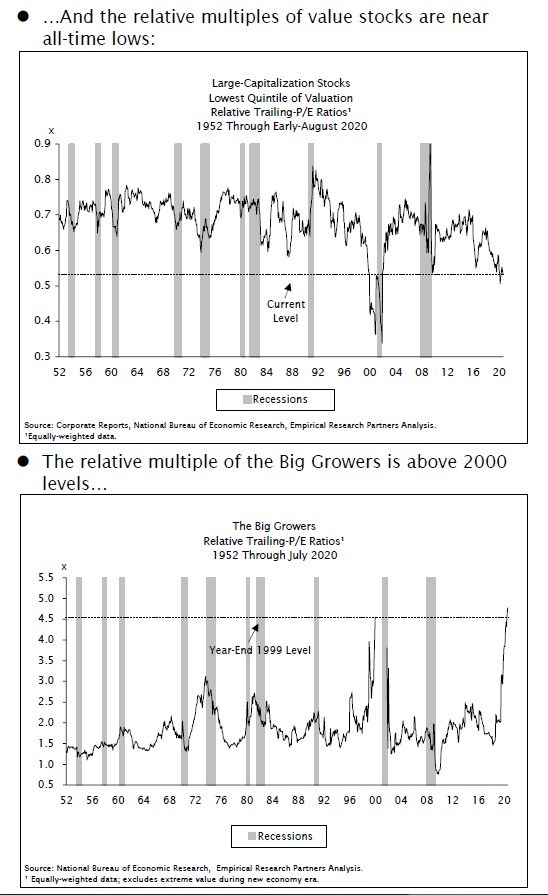
The 75 fastest growing large cap stocks trade at 4.5 times the market multiple, which is above the tech bubble peak. The latest fad explanation is that these growth stocks will grow into their valuations. That’s probably the best case scenario. A stock doing nothing for a few years if the company operates flawlessly is a poor reward. That’s all risk and no reward.
As you can see from the chart below, Apple needs to grow at its historical rate for 5 years to make sense of its current valuation. In other words, the best case scenario is no returns for 5 years. Of course, if you’re betting on near term speculation, you can expect gains. That’s how we’ve gotten the recent fantastic returns. Amazon would need to grow 31 years to fit its valuation. The historical growth rates of these popular tech stocks might not be hit because they are so large. With current margins, Apple and Amazon would need $380 billion and $3.1 trillion in sales to generate these earnings. Both stocks are projected to be the size of the Russell 2000 by analysts as they have no regard for the macro picture.
Conclusion
The BLS labor report will be weak, but the ISM readings suggest stronger employment and manufacturing production are coming. The ADP report missed estimates wildly, but stocks didn’t care as they were laser focused on the coming stimulus package. Large cap growth stocks have never been more expensive on a relative basis. The big tech stocks need years without stock price appreciation to grow into valuations. No return for a few years is the best case scenario. If they don’t execute or face regulatory headwind, their stocks will fall.
Have comments? Join the conversation on Twitter.
Disclaimer: The content on this site is for general informational and entertainment purposes only and should not be construed as financial advice. You agree that any decision you make will be based upon an independent investigation by a certified professional. Please read full disclaimer and privacy policy before reading any of our content.


