UPFINA's Mission: The pursuit of truth in finance and economics to form an unbiased view of current events in order to understand human action, its causes and effects. Read about us and our mission here.
Reading Time: 5 minutes
Pew Research conducted many interesting surveys in January. Since we don’t have access to a myriad of government reports from November and December, these alternative reports carry more weight. The chart below shows a survey conducted from January 9th to the 14th.
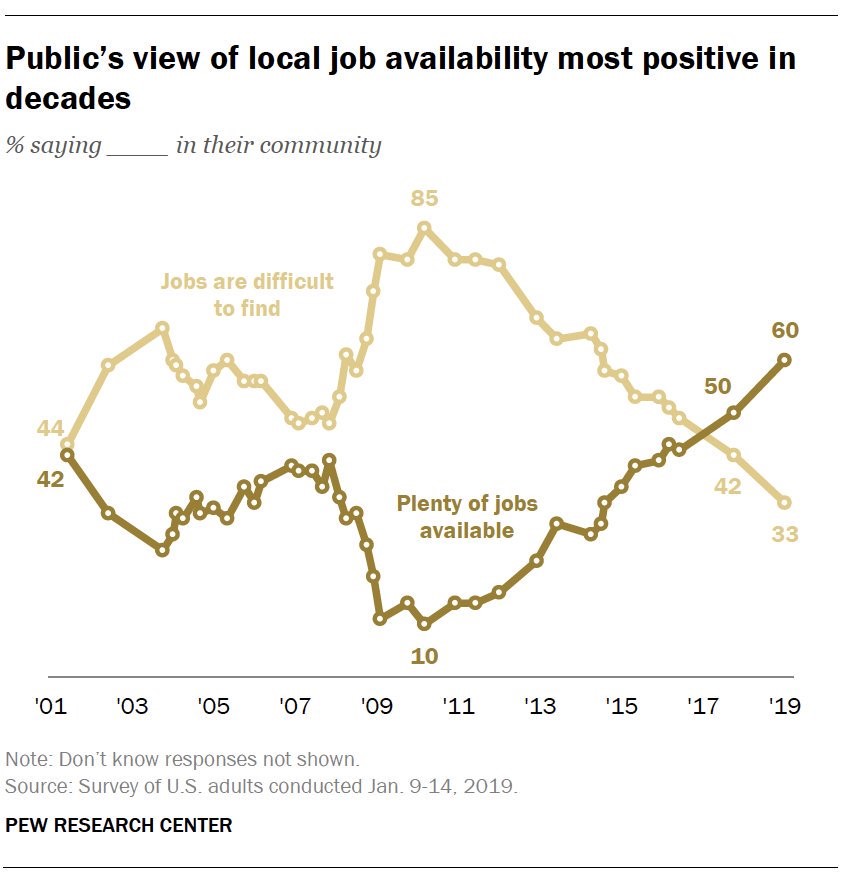
Respondents were asked if jobs were difficult to find in their neighborhood or if there were plenty of jobs available. 60% said there were plenty of jobs which is the highest percentage since the survey started in 2001. 33% said jobs were difficult to find which is the lowest since at least 2001. This survey is consistent with the extremely low jobless claims of 199,000 as of the week of January 19th.
We wish this survey would have captured the end of the 1990s cycle to better compare the fullness of the labor market with that one. The end of the 1990s was when the labor market was the fullest in history in terms of prime age labor participation. All we can tell from this survey is the labor market is much stronger than it was at the peak of last cycle. Since this is the case, it’s fair to assume this strength would challenge the late 1990s labor market.
Even though we often discuss how relatively strong the consumer is because it has deleveraged this cycle, it’s worth noting that there are still a lot of people struggling. Only 51% stated their personal financial situation was excellent or good, while 48% said it was fair or poor. There hasn’t been much vacillation in this survey going back until 2004.
Members of the GOP probably caused the University of Michigan survey to decline in January. In September, 57% of Republicans/lean GOP were expecting economic conditions to improve in the next year compared to only 46% now. This could be because of the Democrats winning the House, the government shutdown, the trade war, or the stock market volatility.
Policy Uncertainty Is A Buy Sign
It’s clear there is high policy uncertainty in America. The Democrats have won the House on the back of a more progressive agenda. We don’t know when the 34 day government shutdown will end. We also don’t know if President Trump will broker a deal with China that will have fair intellectual property laws and lower the American trade deficit. You would think policy uncertainty would be bad news, but the chart below something else.
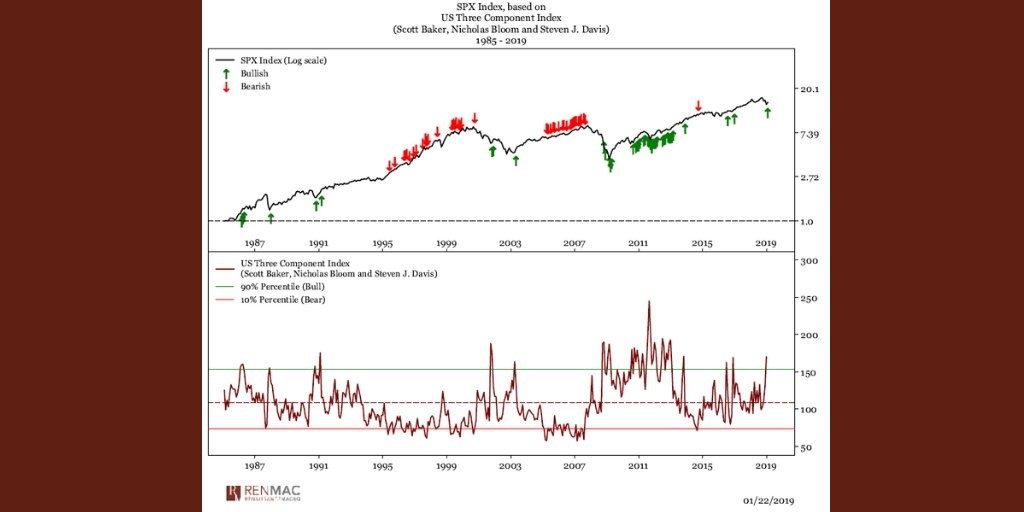
Since the 1980s, it has been a good time to buy the S&P 500 when policy uncertainty was high and a good time to sell when uncertainty was low. That might be because stocks get too expensive when uncertainty is low and stocks get too cheap when uncertainty is high.
The key point is to stay within a range of expectations. If America were to shift from a mixed economy into a socialist one, uncertainty probably wouldn’t successfully work as a buying opportunity. However, if fears of socialist policies become high even though they are unlikely to get enacted, then it would be a huge buying opportunity.
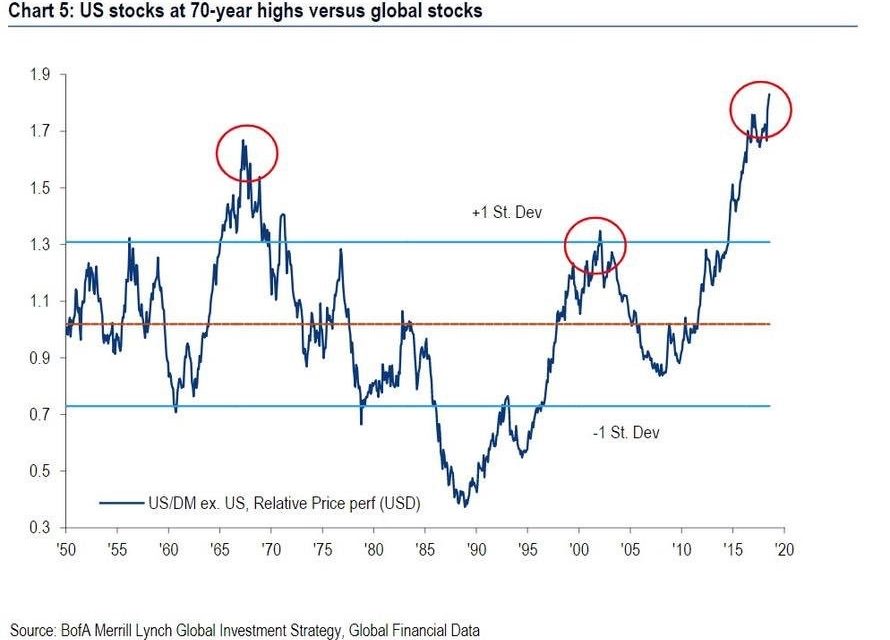
US Stocks At 70 Year High Versus Global Stocks
It’s important for investors to avoid home country bias if they live in America because as the chart below shows, American stocks are at a 70 year high versus other developed markets.
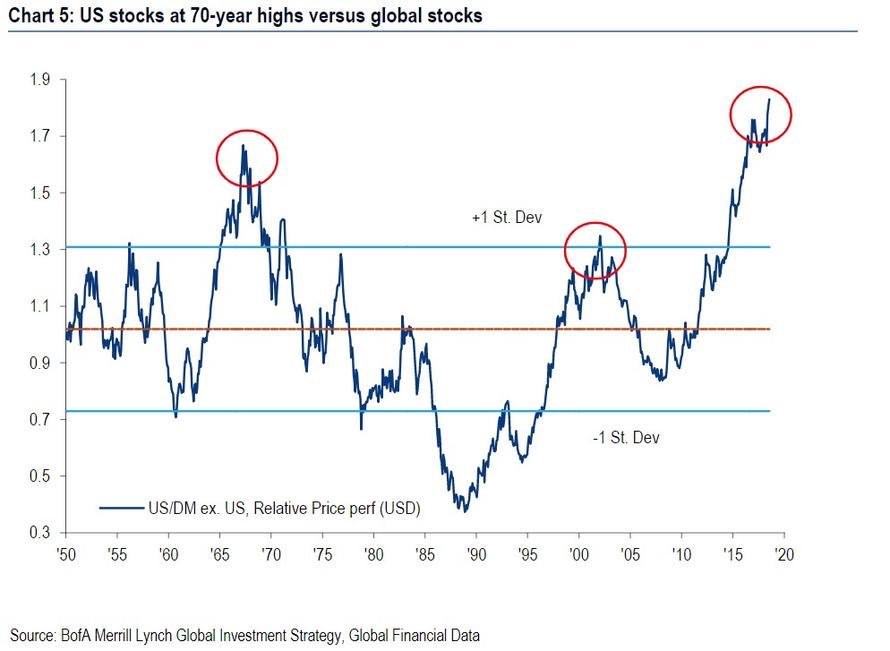
The Shiller PE ratio is at 29 which is above the long term average of 16.6. This 10 year ratio should fall as the 2009 earnings reports stop being included. A big catalyst for this rally in American stock during the past decade versus other developed markets is America’s major internet names. America has a bigger tech sector than other countries.
In terms of CAPE, this relationship has occurred because foreign stocks are very cheap and American stocks are more expensive than average. Keep in mind, this chart doesn’t mean a reversal will occur this year. The European economy is weakening quickly while America is probably in a slowdown. One example of the weakness in Europe is that in France business confidence fell to 102 in January. Besides December, that’s the lowest reading since November 2016.
Earnings Update
Q4 2018 earnings haven’t been terrible, but their effect on future estimates has been. Specifically, as of Wednesday evening, 107 S&P 500 firms have reported EPS growth of 17.9% with 73% beating estimates. They have had 6.1% sales growth as 58% have beaten estimates.
The chart below shows the demise of 2019 EPS growth estimates. To be clear, the Q4 EPS growth shown below is a blended average which means it includes results and estimates.
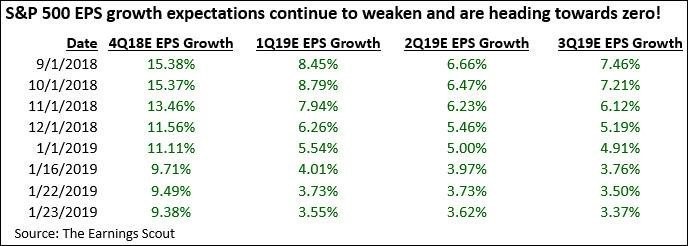
Q1, Q2, and Q3 are all expected to have EPS growth with a 3 handle. That’s not enough to send stocks in a bear market, but the recent trend signals the decline in estimates won’t stop here. There are still a couple months before Q1 EPS results come out. Bad guidance from the firms which haven’t reported Q4 results yet could send expectations for growth negative.
FHFA House Price Index
The November FHFA report gives us further clarity into how weak the housing market was at the end of last year. The FHFA house price index showed stable price growth. Month over month price growth was 0.4% which beat estimates for 0.3% and met the growth in October. Yearly growth was stable at 5.8% as the chart below shows.
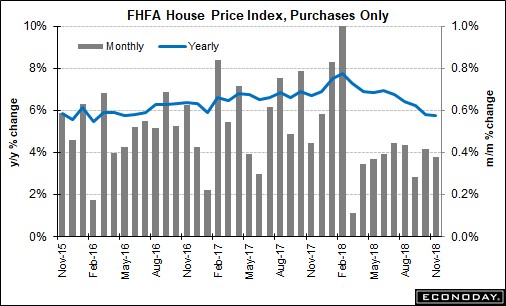
Yearly Pacific price growth weakened 0.9% to just 4.8%. That’s about half the growth rate in the middle of 2018. The Mountain region had 7.4% growth which was down 1.3% form October. The East South Central improved the most as growth increased from 4.9% to 7.3%. Mid-Atlantic price growth improved from 3.4% to 4.8%. The fact that this housing report wasn’t a disaster should be considered good news.
Conclusion
It’s no surprise the labor market is strong, and the housing market was relatively weak in November. It’s interesting to see that the sharp weakness in the Pacific and the recent pickup in the Mid-Atlantic have put their price growth rates on par. Political instability has been a buying opportunity in the past. However, that buying opportunity may have been in December as stocks have rallied very quickly this year already. Some year-end S&P 500 targets have been surpassed in the first month. It might not be ideal to buy stocks now as earnings estimates have been cratering. It wouldn’t be bad if earnings grew 3% in 2019, but that doesn’t seem like where estimates will end up. In the long run, American stocks might underperform as they are at a 70 year high versus global stocks.
Have comments? Join the conversation on Twitter.
Disclaimer: The content on this site is for general informational and entertainment purposes only and should not be construed as financial advice. You agree that any decision you make will be based upon an independent investigation by a certified professional. Please read full disclaimer and privacy policy before reading any of our content.


