
UPFINA's Mission: The pursuit of truth in finance and economics to form an unbiased view of current events in order to understand human action, its causes and effects. Read about us and our mission here.
Reading Time: 5 minutes
Since December 2018, the S&P 1500 housing market index has rallied in line with inverted 30 year fixed mortgage rates. The correlation has been very high. That rally in these stocks along with the decline in rates, made the 2 point decline in the Housing Market index in June a surprise. It fell from 66 to 64 which missed estimates for 67. This wasn’t a terrible report; it was just a disappointment.
Specifically, the single family present sales index fell from 72 to 71. The 6 month expected sales index fell 2 points to 70. Finally, the traffic of prospective buyers index fell 1 point to 48. Anything below 50 is a contraction. This index has been below 50 since last October. The decline in rates and home price growth haven’t catalyzed traffic growth. The overall index fell because of the Northeast and the West as those indexes fell 5 and 4 points to 60 and 69. The South was stable at 68 and the Midwest increased 3 points to 59.
Not Great Housing Starts & Permits
Even though both May housing starts and permits beat estimates and starts were revised higher, this wasn’t a great report. Starts were 1.269 million which beat estimates for 1.230 million. April and March’s readings were revised up by a total of 77,000. April went from 1.235 million to 1.281 million. May permits were 1.294 million which beat estimates for 1.29 million. April’s reading was revised down slightly from 1.296 million to 1.29 million.
You can tell this wasn’t a great report because the Atlanta Fed’s forecast for Q2 real residential investment growth was pushed lower from 0.4% to 0.3%. At least it’s still positive which would be a change from the past 5 quarters. The table below shows the strength in starts and permits is in the multi-family category as single family starts were down a lot.
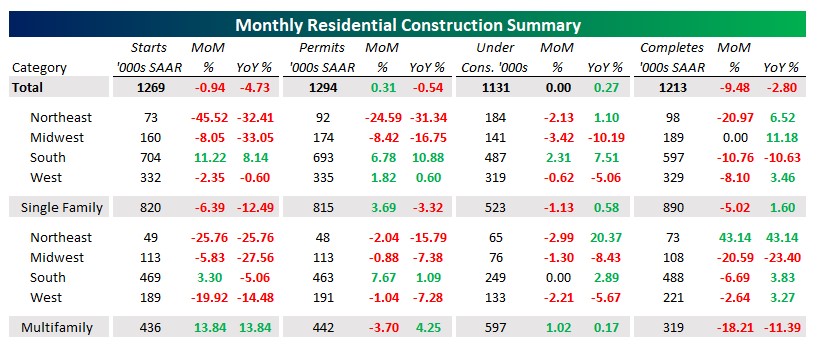
Specifically, multi-family starts and permits were up 13.84% and 4.25% yearly. For single family homes, there was a 12.49% and 3.32% yearly decline. For completions it was the opposite as single family completions were up 1.6% and multi-family completions were down 11.39% yearly.
Regional Data & Potential Increase In Starts
Let’s look at the regional data. It’s great to see the South have solid growth in single family housing starts, permits, and homes under construction as it is the biggest region. The Midwest had the highest affordability index in April as it was 187.8. That didn’t equate to strong single family starts or permits as they fell 33.05% and 16.75% yearly. Maybe the improvement in its Housing Market index means this decline is near its end.
Speaking of predicting housing starts, the chart below shows mortgage applications are correlated with future housing starts growth.
Starts were weak at the end of last year which likely means yearly growth will be positive. Further good news for the housing market is the monthly supply of houses has worked through the glut seen late last year. There was 7.4 months of housing supply in December; as of April it’s down to 5.9 months.
Terrible Cass Freight Shipments Index
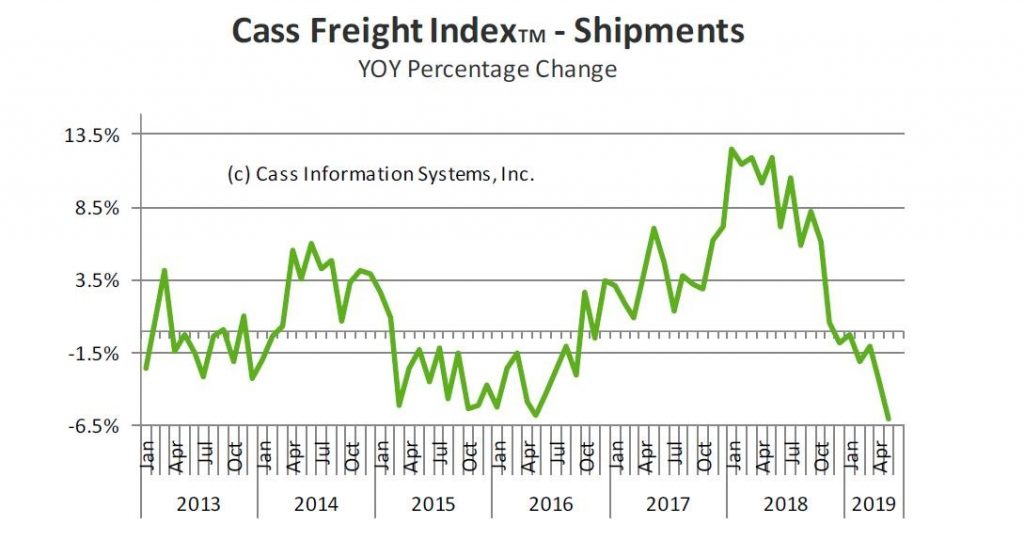
The Cass Freight Shipments index shows the economy is headed in the wrong direction as yearly growth in May was -6%. Volume has fallen 6 months in a row. Expenditures fell 1% yearly. Cass Information Systems stated in their May report, “With the -6.0% drop in May, we see the shipments index as going from “warning of a potential slowdown” to “signaling an economic contraction.” This isn’t a prediction; it’s reality. This report shows the economy is in a deep slowdown like 2015-2016. The “storm clouds” mentioned were tariffs, the decline in WTI crude oil, and weak housing starts.
Shipments growth first turned positive in October 2016; expenditures growth turned positive 3 months later. The S&P 500 bottomed in February 2016 which was way before that. Similarly, the stock market peaked in September 2018 which was before growth went negative in December. The curious situation now is stocks have been rallying for about 6 months while this index’s growth rate has plummeted. Can the 20% stock market decline in Q4 2018 price in the current weakness in the Cass Freight index if the stock market has since rallied to new highs? At what point does this weakness cause investors to second guess their bullishness? The slowdown turning into a recession would certainly end the stock market rally. On the other hand, it’s possible the shipments index improves if/when a trade deal with China is made.
June Bank Of America Fund Manager Survey
The June Bank of America fund manager survey was shockingly bearish. Clearly, these fund managers think economic weakness and the risk of an all-out trade war with China aren’t priced in. That being said, if they are wrong, stocks have room to run. Bull markets are built on skepticism. Specifically, fund managers had the largest increase in cash positioning since the 2011 debt crisis. They had the lowest allocation to equities in relation to bonds since May 2009. There was a record decline in global growth expectations. There was a record high percentage saying the global economy is late cycle.
The chart below describes the last point. As you can see, 87% of fund managers think the global economy is late cycle.
Only 13% said it’s mid cycle and 0% said it’s early cycle. To be clear, the global economy has had 2 recessions since the last U.S. recession. In those recessions, the economy was said to have been mid cycle in this survey. Fund managers said the economy was late cycle in most of 2005 and all of 2006, 2007, and 2008. They weren’t necessarily wrong in 2005 and 2006 (and in 2018) because being late cycle doesn’t mean a recession will come in a specific time; it just means it is closing in.
The second Bank of America chart below shows the monthly drop in equity allocation was the 2nd biggest ever and the overall equity allocation was the 2nd lowest ever.
The equity to bond allocation differential was 1% which is the lowest since May 2009. The MSCI global index in relation to the TLT, which is an ETF for long U.S. treasury bonds, isn’t showing as much panic as the stock bond spread.
Conclusion
Real residential investment growth might be positive in Q2 and housing starts might have positive growth in the 2nd half of the year. However, the May residential construction report showed there were yearly declines in starts, permits, and completions. The Cass Freight index had its 6th straight yearly decline. Fund managers were very bearish in June as they raised cash, sold stocks, and stated the economy is late cycle.
Have comments? Join the conversation on Twitter.
Disclaimer: The content on this site is for general informational and entertainment purposes only and should not be construed as financial advice. You agree that any decision you make will be based upon an independent investigation by a certified professional. Please read full disclaimer and privacy policy before reading any of our content.


