UPFINA's Mission: The pursuit of truth in finance and economics to form an unbiased view of current events in order to understand human action, its causes and effects. Read about us and our mission here.
Reading Time: 4 minutes
We believe the table below is the most valuable chart of the year. As you can see, it ranks economic data across 5 factors: timeliness, revisions, volatility, surprise, and correlation. The reports in red are soft data reports and the ones in black are hard data. Right off the bat, soft data reports have an edge because they usually come out before hard data. On the other hand, you can say they are hampered by the fact that expectations have less information to go by.
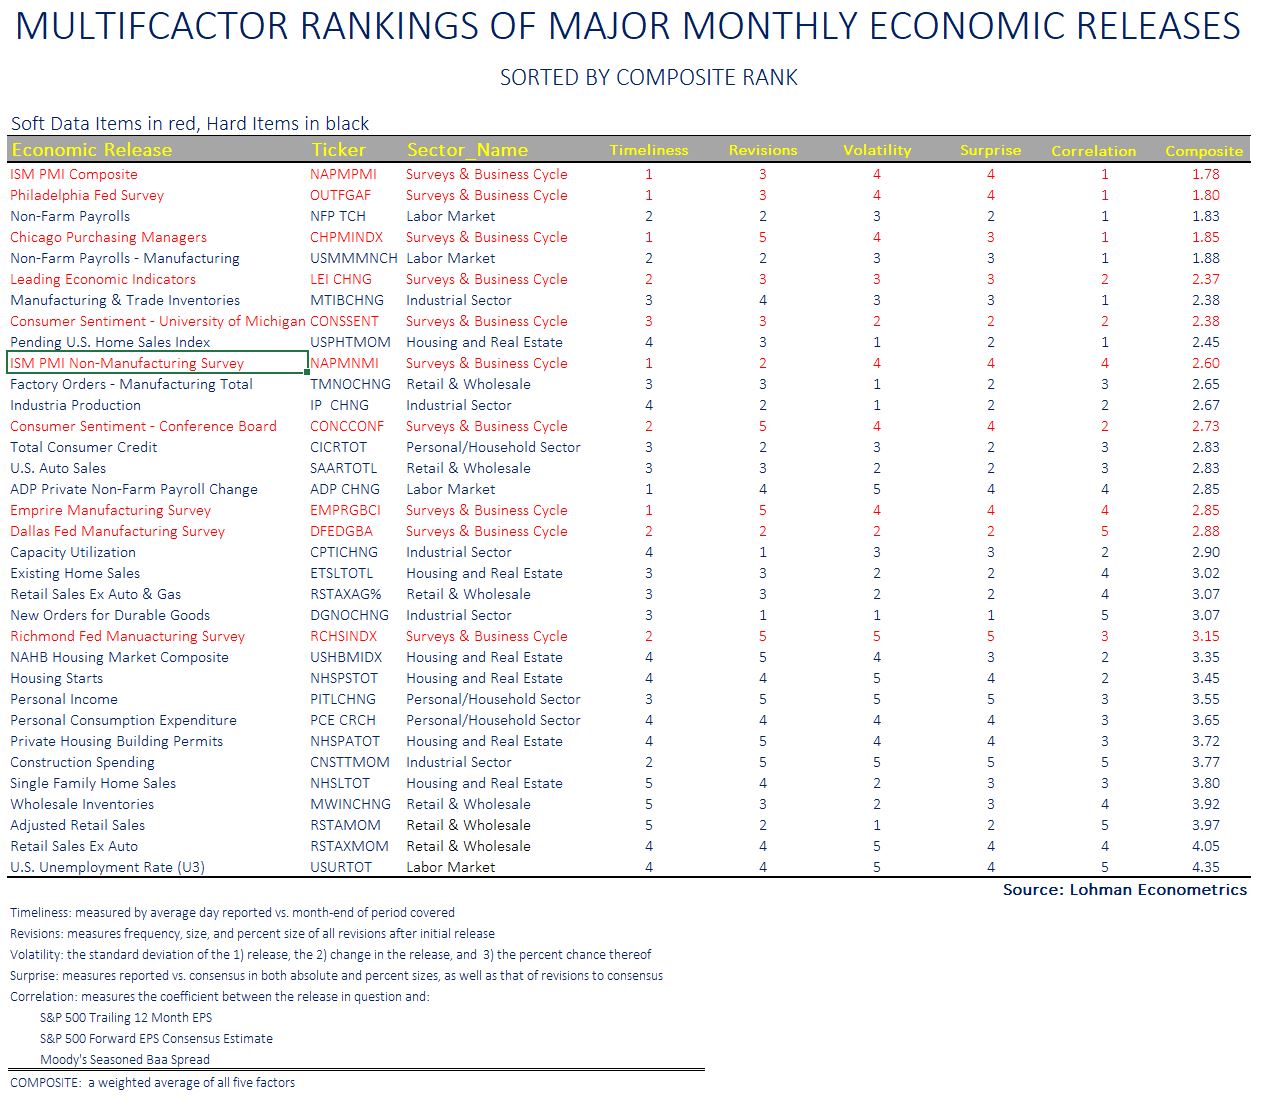
For example, the ADP report comes out before the non-farm payrolls report. The ADP report can help alter expectations for non-farm payrolls which makes them less likely to miss estimates. Sure enough, the ADP report has a 1 on timeliness (the best) and a 4 for surprise as it misses estimates handily. The non-farm payrolls report has a 2 for timeliness and a 2 for surprise.
It’s great if a report is timely and has a high correlation. The correlation metric is based on trailing 12 month EPS, forward EPS estimates, and the Baa spread. The ISM PMI composite is a winner because it has a high correlation and comes out soon after the month ends. The January manufacturing PMI comes out next Monday and the composite (along with services) comes out on Wednesday. It’s notable how much higher ranked PCE is over retail sales ex-autos and gas. We will review the pending home sales in this report; it has a strong composite reading of 2.45.
Election Volatility Coming
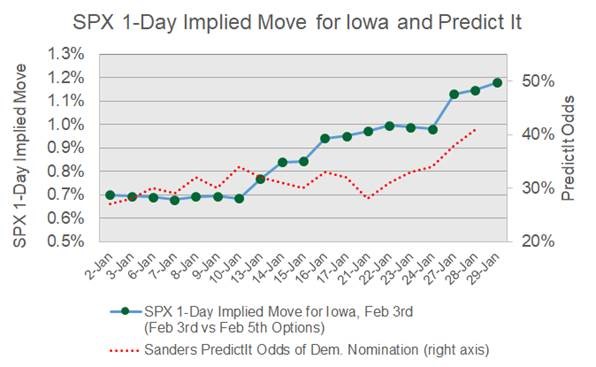
We have discussed in previous articles that Sanders winning the Democratic nomination likely isn’t fully priced into stocks. However, the options market is forecasting volatility on February 3rd which is the Iowa caucus. As you can see from the chart below, Sanders’ odds of winning the nomination have been positively correlated with the implied move on the day of the caucus. The options market expects a 1.2% move on that day which is up from 0.7% a couple weeks ago.
In the average of recent polls in Iowa, Sanders has a 3.6% lead. On PredictIt, Sanders has a 63% chance of winning Iowa, an 80% chance of winning New Hampshire, and a 65% chance of winning Nevada. Biden has a 74% chance of winning South Carolina. Sanders sweeping the first 3 states could cause stocks to decline in February.
Home Price Growth Increases
As we saw from the December Redfin data, home price growth is bottoming. Monthly price growth in the 20 city Case Shiller index was 0.5% in November which beat estimates and the prior reading of 0.4%. Yearly non-seasonally adjusted price growth increased from 2.2% to 2.6%. Yearly national non-seasonally adjusted price growth rose from 3.3% to 3.5%. Big city price growth is still below national price growth.
The 2 year growth stack in national home prices fell. Specifically, yearly growth last year fell from 5.3% to 5% which means the 2 year growth stack was down 0.1%. Price growth will likely improve in the next few months as comps will continue to get easier.
Looking at individual cities, price growth in Phoenix improved from 5.8% to 5.9% (non-seasonally adjusted). It had the strongest growth. Charlotte is catching up as its yearly price growth was up from 4.8% to 5.2% which was its highest growth since November 2018. Growth in Las Vegas stopped falling for the first time since August 2018 as it rose from 2.2% to 2.6%. The comp was 0.8% easier, so the 2 year growth stack still fell. The 2nd weakest city was San Francisco which had 0.5% growth which was up from -0.5%. The weakest city was Chicago as it had 0.4% growth which was up 0.1%.
Big Decline In Pending Home Sales
The pending home sales index fell 4.9% monthly in December. That was down from 1.2% growth and missed estimates for 0.4% growth. The lowest estimate was 0%. The index fell from 108.5 to 103.2. This was the largest decline since May 2010 and the largest negative surprise in 5 years as you can see from the chart below. Within this report, every region fell. The index was down 4% in the Northeast, 3.6% in the Midwest, 5.5% in the South, and 5.4% in the West. Remember, the South had a big decline in new home sales and the West had a big increase.
NAR’s chief economists blamed a lack of supply for this drop. He stated, “The state of housing in 2020 will depend on whether homebuilders bring more affordable homes to the market. Home prices and even rents are increasing too rapidly, and more inventory would help correct the problem and slow price gains.” Homebuilders have an opening to build affordable housing as existing home inventory is low. Existing homes provide competition for new homes on the low end because they are cheaper. There is less competition for new homes to deal with since existing home inventory is at a record low.
MBA Applications Spike
Despite the sequential weakness in new and pending home sales, the MBA applications report in the week of January 24th was strong. It has been strong all year. As you can see in the chart below, the purchase applications index rose to the highest level since the 2008 housing bust. The composite index was up 7.2% weekly after falling 1.2%. The purchase index was up 5% after falling 2%. Yearly purchase applications growth was 17%.
Conclusion
The number one rated report according to Lohman Econometrics is the ISM composite. It comes out on Wednesday. Stocks should face volatility if Bernie wins the first 3 elections in the Democratic primary like it looks like he will. The Case Shiller home price index showed higher growth because of easier comps. Home price growth has bottomed. The pending home sales index missed estimates widely and fell sharply. The good news is the housing purchase applications index was up sharply on a weekly and yearly basis. It has been strong all year.
Have comments? Join the conversation on Twitter.
Disclaimer: The content on this site is for general informational and entertainment purposes only and should not be construed as financial advice. You agree that any decision you make will be based upon an independent investigation by a certified professional. Please read full disclaimer and privacy policy before reading any of our content.


