UPFINA's Mission: The pursuit of truth in finance and economics to form an unbiased view of current events in order to understand human action, its causes and effects. Read about us and our mission here.
Reading Time: 4 minutes
As the 10 year treasury yield rises above the stock market’s dividend yield, there is a debate that suggests this means stocks are a bad place to be. That’s nonsense because stocks have a free cash flow yield. You don’t value a stock just based on the dividends it pays in the current year.
As you can see from the chart below, the 10 year treasury yield was much higher than the S&P 500’s dividend yield from the late 1990s to the late 2000s.
Actually, the treasury yield being higher than the dividend yield is normal. The recent periods where the dividend yield was higher just made buying stocks over the treasury that much better for long term investors. Buying the 10 year bond when it has below a 2% yield is mainly for traders and investors trying to diversify risk. This long term chart also serves to show that the 10 year yield has been above 2% for a lot of the past decade. Let’s not get ahead of ourselves. It wouldn’t be the end of the world if the 10 year yield stayed between 2% and 2.25% in the 2nd half of 2021.
Recent History
If the treasury yield were to spike substantially, many risk stocks would implode and the interest on the Federal debt could become an issue. The Fed doesn’t want to admit that it would stop such a movement because that would impact current markets. The Fed will only comment when it sees the need to put out a fire. Don’t take the Fed’s current words at face value. If the 10 year yield were to rise to 4% in a hypothetical scenario, the Fed would probably intervene depending on the ramifications of that movement.
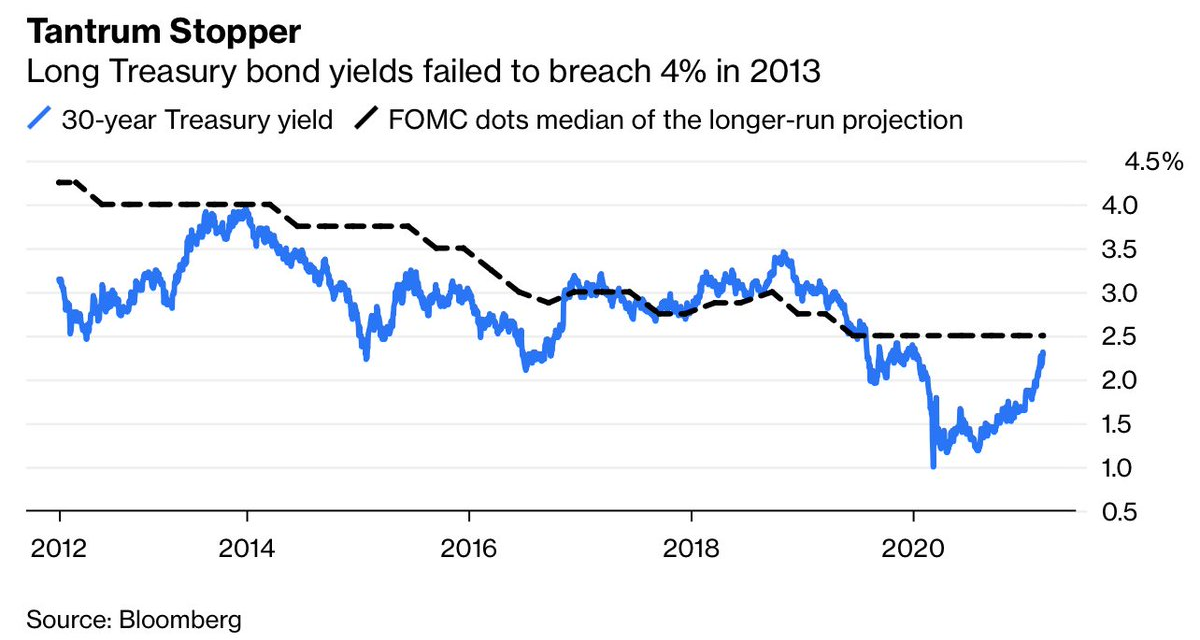
The chart below is a really interesting way of framing the Fed’s role in potentially affecting the long bond.
As you can see, the median longer run dot plot has almost perfectly acted as a ceiling for the 30 year yield. To be fair, the Fed dot plots are based on the current economy which is what the 30 year yield is based on. Therefore, it’s not surprising the 30 year yield wouldn’t rise much above it based on inflation and growth estimates.
The median dot plot has been steadily falling since 2012. It’s currently at 2.5% which means the 30 year yield probably won’t get above 3%. The Fed views the growth boom this year as transitory. It’s very unlikely to change its median longer run projection this year. On the other hand, the Fed won’t be hiking rates this year and possibly not next year. It is expected to let the economy run hot which could cause treasury yields to rise. The trend in the past few decades has been declining rates and inflation. We will see if very loose monetary conditions and stimulative fiscal policy can finally get inflation to end its downtrend. This is a new policy experiment. We won’t know its impact until 12 months from now.
Long Yield Rooted In Growth Expectations
The 10 year yield has been rising quickly which is unnerving some investors. However, so have economic growth estimates and prices paid. As you can see from the chart below, the 10 year yield has been matching the spike in the 2021 GDP growth estimate which is now up to 5.5%. Growth estimates might not have that much further to rise, but the 10 year yield isn’t going to fall if they stay high.
The 10 year yield being above 1.5% is the new normal. Economists and policymakers should be rooting for the 10 year yield to rise because that means the vaccinations are going well. It’s a case of wanting just enough of a good thing. A 10 year yield of 2% is a good thing because it means economic growth is stronger. A 10 year yield of 4% is a bad thing because it could hurt stocks and spike debt servicing costs. We’re using 4% as a high reading that’s somewhat possible. Of course, a 10% yield would cause major damage, but that’s not within the realm of current possibilities.
Inflation Beta
We know that a spike in inflation is bad for real stock returns and good for commodities. The table below gives us the details from 1970 to 2020. As you can see, commodities have a beta of 4 which is very high. In periods of rising inflation, real returns are 14.6% per year. This is why commodity investors are always chasing a new cycle. When they find the golden goose, it gives them a huge windfall.
On the other hand, the S&P 500 falls 0.4% per year after taking out inflation. Some poor analysis doesn’t account for inflation which is a bigger deal when its increasing. Of course, the S&P 500 doesn’t do that badly because it has energy and bank stocks in it. The Nasdaq probably does much worse.
Tech Doesn’t Always Win
Technology isn’t a great investment just because it grows quickly and helps the world. In fact, without barriers to entry, technology benefits consumers rather than producers. The chart below shows the price of the British railway index from the 1820s to 1920. It was a successful technology, but didn’t have barriers to entry, so the stocks fell. This could be the case for cloud companies because there are so many new providers who are willing to take losses in the first few years of operations.
There is so much new competition in this space. Just because it’s a sticky service doesn’t mean they will be highly profitable. They are always spending to grow and usually don’t take stock-based compensation into account. When companies shop around for their first provider, they will look for more discounts because of heightened competition.
Conclusion
Stocks aren’t a sell just because the treasury yield is higher than their dividend yield. 3% might be the ceiling for the 30 year yield based on the Fed’s median longer run dot plot. The 10 year yield should be rising because growth estimates are rising. Commodities do really well with rising inflation. Stocks have negative real returns. Technology advancements accrue to consumers if there are no barriers to entry.
Have comments? Join the conversation on Twitter.
Disclaimer: The content on this site is for general informational and entertainment purposes only and should not be construed as financial advice. You agree that any decision you make will be based upon an independent investigation by a certified professional. Please read full disclaimer and privacy policy before reading any of our content.


