UPFINA's Mission: The pursuit of truth in finance and economics to form an unbiased view of current events in order to understand human action, its causes and effects. Read about us and our mission here.
Reading Time: 4 minutes
The business cycle is in its early innings of improvement. That sounds odd to people who follow the stock market more than the economy because stocks have been ramping since March 2020. The stock market once again correctly predicted the incoming economic rebound. This was one of the fastest stock market recoveries ever. It matches the V-shaped recovery in the economy.
Economists almost always are hesitant to predict such a fast recovery because it’s aggressive. There is career risk in saying the economy is going to go back to normal within a few quarters because it sounds like you aren’t cognizant of the pain people are going through. Smart equity investors know that it’s always darkest before the bottom. When cyclical stocks do so badly that the biggest firms’ stocks are down 80% and many of the smaller firms either have penny stocks or have gone bankrupt, you know we are close to a bottom. The cyclical bulls (specifically the energy bulls) were dead right to go long last year.
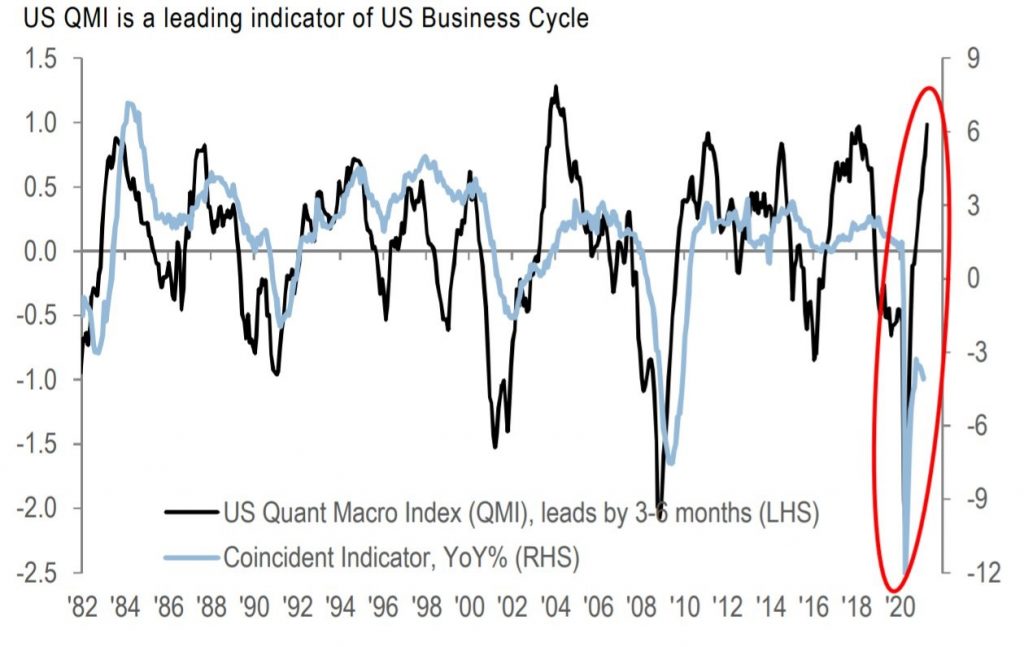
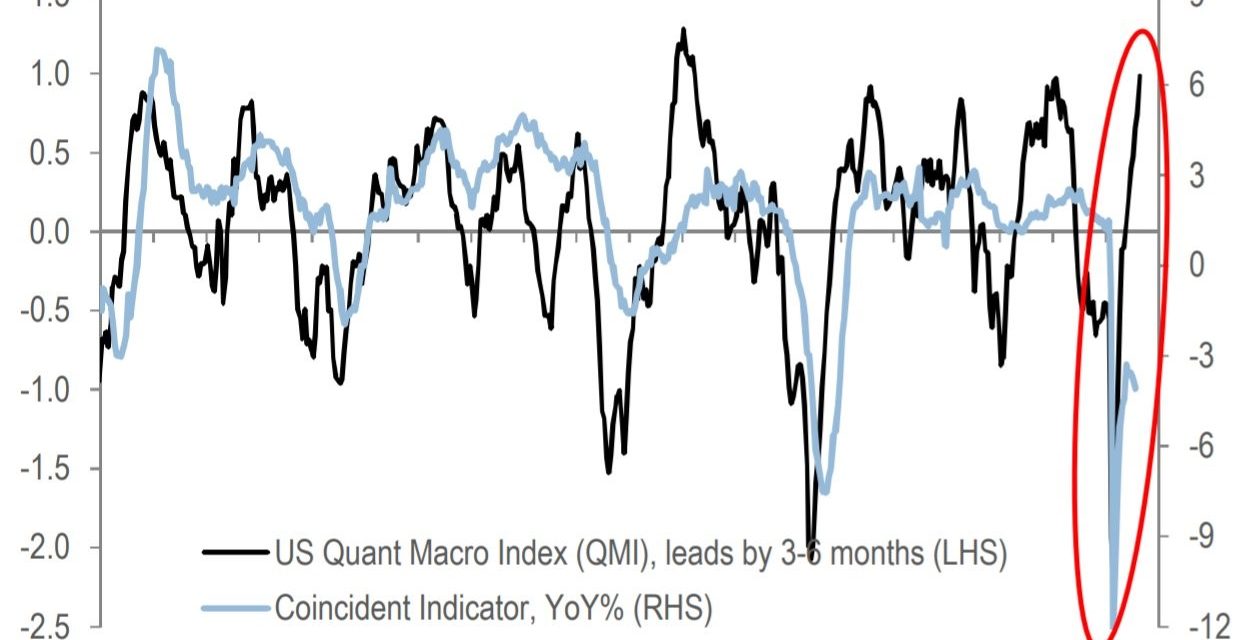
As you can see from the chart above, the quant macro leading index is back to a cyclical high point. The coincident indicator is still quite negative because it doesn’t include much of the full economic reopening. You can’t buy cyclical stocks based on the coincident indicator. If you buy cyclicals after the leading indicator looks strong, you will likely miss most of the strongest part of the bull run. You need to anticipate a recovery in the leading indicators if you want to make the most money.
We aren’t saying that now is the time to sell energy and other cyclicals. It’s simply clear most of the quickest gains have been had. In the past year, the XLI industrials index is up 61.4%. Since April 27th, it’s up 92 basis points. The gains have been moderating in line with the incoming spike in the coincident indicator. Once we get complete data, from May and June, we will see a major spike in the coincident index
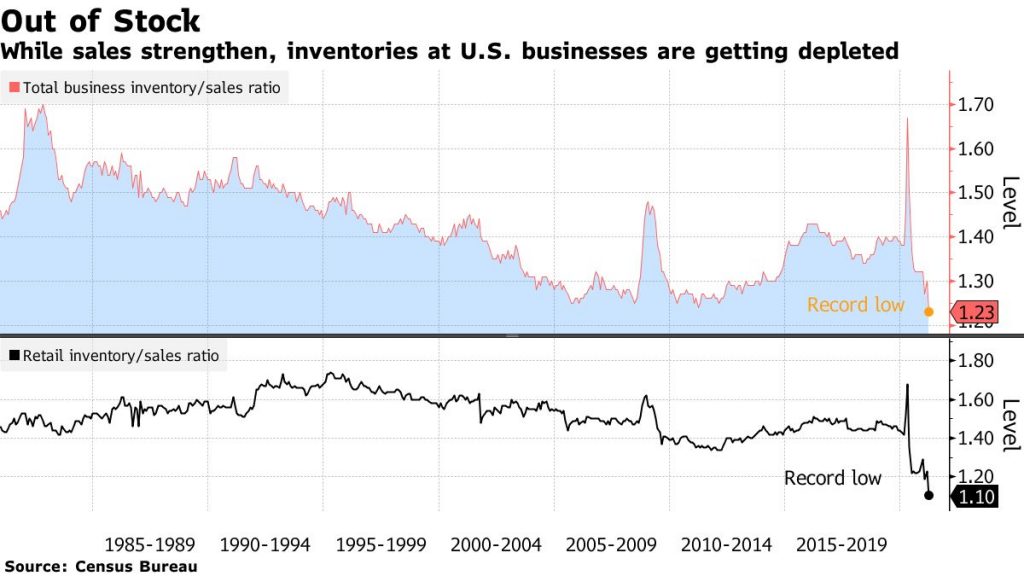
Inventory To Sales Ratio Hits A Record Low
The supply chain issues and the spike in demand due to the reopening and the stimulus have pushed the inventory to sales ratio to a record low. This is much different than the early 1980s when inflation was roaring (ratio was higher). That makes it seem like the current spike in inflation is much less sustainable.
We need the pandemic to end to alleviate the shipping delays. Once the supply chain normalizes and demand dies down following the initial buying wave due to the economic reopening, inflation should fall. That sounds like a lot, but those are all temporary issues that will normalize. The other potentially temporary constraint is the huge demand for chips. If crypto mining falls due to a decline in their prices, we could see the chip shortage largely go away.
Philly Fed Again Signals Hot Economy
The Philly Fed manufacturing index cooled off in May, but the inflation gauges exploded further. This is a very strong signal of hot inflation in the next couple months. While the Fed likes to say it’s transitory (which it is), this will hurt corporate profits and consumers in the near term. Specifically, the overall manufacturing index fell from 50.2 to 31.5. That’s still a very strong reading even though it’s down a lot. It can’t stay in the 50s indefinitely. General business activity can’t improve each month for most companies in each report. That’s not possible. Furthermore, the 6 month expectations index was down from 66.6 to 52.7. Once again, this is a really good reading.
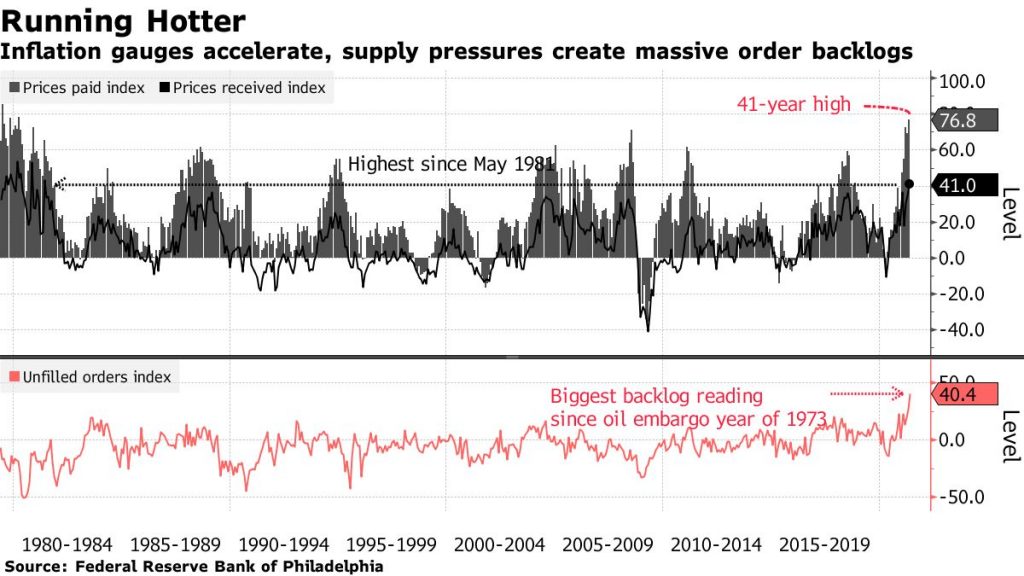
The prices indexes did the seemingly impossible in May. That’s the best way to describe the massive percentage of firms seeing higher prices. The prices paid index rose from 69.1 to 76.8. Somehow 76.8% of firms paid higher prices and 0% paid lower prices. This seems impossible.
Plus, the prices received index was up from 34.5 to 41. As you can see from the top chart above, the prices paid index hit a 41 year high and the prices received index was the highest since May 1981. Furthermore, the unfilled orders index rose to 40.4 from 27.2 which was the highest level since 1973 (the oil embargo). This index should fall in the coming months which should lower inflation pressures.
The Oil Market Is Now Balanced
Oil is one of the few commodities that hasn’t spiked in the past few months. The current price of WTI oil is only $63-$64. Some investors are probably anticipating the return of US fracking and Iranian production. With a big increase in US production, it will be better to own the low-cost producers than the commodity itself.
Super majors have lowered capex. Frackers won’t be able to make up for this supply cut. That’s the bull case beyond the initial surge in demand once traveling fully comes back to normal (and temporarily spikes above normal levels). As you can see from the chart below, the US oil inventory surplus is at its 4 year average. That hasn’t been enough to push oil into the $70s. The bulls believe the surplus will dwindle further in the summer. The second chart shows the surplus of crude, gas, and distillate is much below the 5 year average. It’s nearly at a 5 year low.
Conclusion
The economy is going to improve sharply in the next few months, but don’t expect cyclical stocks to explode on these great readings. It’s sort of like ‘buy the rumor sell the news’, except this is ‘buy the expected recovery and hold as the data gets better.’ Supply chain issues got so bad in April that the inventory to sales ratio hit a record low. The Philly Fed index showed extreme inflation readings in May. Hopefully, the bottlenecks are solved within the next few months. Oil prices haven’t rallied with most other commodities. Oil inventory supply is at its 4 year average. If it falls further, prices might creep up this summer.
Have comments? Join the conversation on Twitter.
Disclaimer: The content on this site is for general informational and entertainment purposes only and should not be construed as financial advice. You agree that any decision you make will be based upon an independent investigation by a certified professional. Please read full disclaimer and privacy policy before reading any of our content.


