UPFINA's Mission: The pursuit of truth in finance and economics to form an unbiased view of current events in order to understand human action, its causes and effects. Read about us and our mission here.
Reading Time: 5 minutes
The October CPI report missed estimates on a monthly and yearly basis for core and headline inflation. That was the opposite of what the ISM and Markit reports showed in their prices indexes. Investors are not worried about inflation in the near term now that COVID-19 is back and worse than it was in the summer. Inflation should increase after COVID-19 is controlled via the vaccines, therapeutics, and testing. Until then there is a low chance of it getting above 2%.
Speaking of COVID-19, the best way to measure the virus is hospitalizations because deaths lag and cases are impacted by false positives and false negatives as well as the amount of testing. To be clear, as testing increases, the methods change, changing the effectiveness of the tests. The one issue with hospitalizations is many states didn’t report their data in the spring, so it makes hospitalizations look lower than they were. The best chart to look at is the one in the bottom right because it adjusts for the states that didn’t report in the spring. This current outbreak is worse than the summer, but not yet worse than the spring. That can easily change within a few weeks.
Getting back to the CPI report, headline CPI was 1.2% which was down from 1.4% and missed estimates by 0.1%. Core CPI was 1.6% which missed estimates and the consensus of 1.7%. The chart below shows inflation in each category with the width measuring its importance. Housing inflation is the most important category. It’s low despite the hot housing market because this reading is based on rent inflation which is low because of restrictions, lower demand, and the inability of renters to pay. Landlords are just happy to get paid; they aren’t raising rents.
Food inflation was 3.9% as “food at home” and “food away from home” inflation were 4% and 3.9%. Once again, meats, poultry, eggs, and fish lifted “food at home” inflation as its inflation was 6.1%. Limited service meals had a 5.7% spike in prices because of increased demand for quick meals which are more socially distanced than full-service meals (2.8% inflation). Energy had a 9.2% decline in prices which was driven by the 18.1% decline in commodities prices. Fuel oil inflation was -28.2% and gas inflation was -18%. These are going to make for very easy comps next year when the economy reopens causing demand to normalize.
Within core inflation, commodities inflation was only 1.2%. The lowest inflation in that category was apparel which had -5.5% inflation. Apparel inflation has been low for years, but it’s especially so now that there is less demand. There is less of a need for new outfits if there aren’t gatherings. The highest inflation was in used cars and trucks which was 11.5%. That could be a near its peak because most of the people who needed a used vehicle, now that public transportation is less safe, have already bought one. When public transportation comes back, there could be a supply glut as people will sell their vehicles.
Core services inflation was 1.7%. Transportation services inflation was -5.1% and shelter inflation was 2%. As we mentioned, it’s based on rents which haven’t increased much. House price growth is much higher than 2%. Medical care inflation was 3.7% which sounds high compared to the other categories, but is actually very low compared to where it was earlier in the year. It was down from 4.9% in September and the peak of 6% in June. The comp was 7 tenths harder, meaning the 2 year stack fell 0.5%. Medical care commodities inflation crashed from 0.9% to -0.8% which caused the 2 year stack to fall 0.4%. The stack change tells you the change without the effect from comps.
2025 Rate Hike
Inflation isn’t going above 2% within this pandemic. Furthermore, as you can see from the chart below, even it was to go above 2%, rates wouldn’t rise like they normally would. With the Fed’s old framework, hikes would start in late 2022. Supposedly, with the new framework hikes won’t start until 2025. However, this will be a different type of recovery. If the economy’s reopening caused the labor market to tighten very quickly (low probability), the Fed might need to recalibrate its plan.
Much Improved Jobless Claims Report
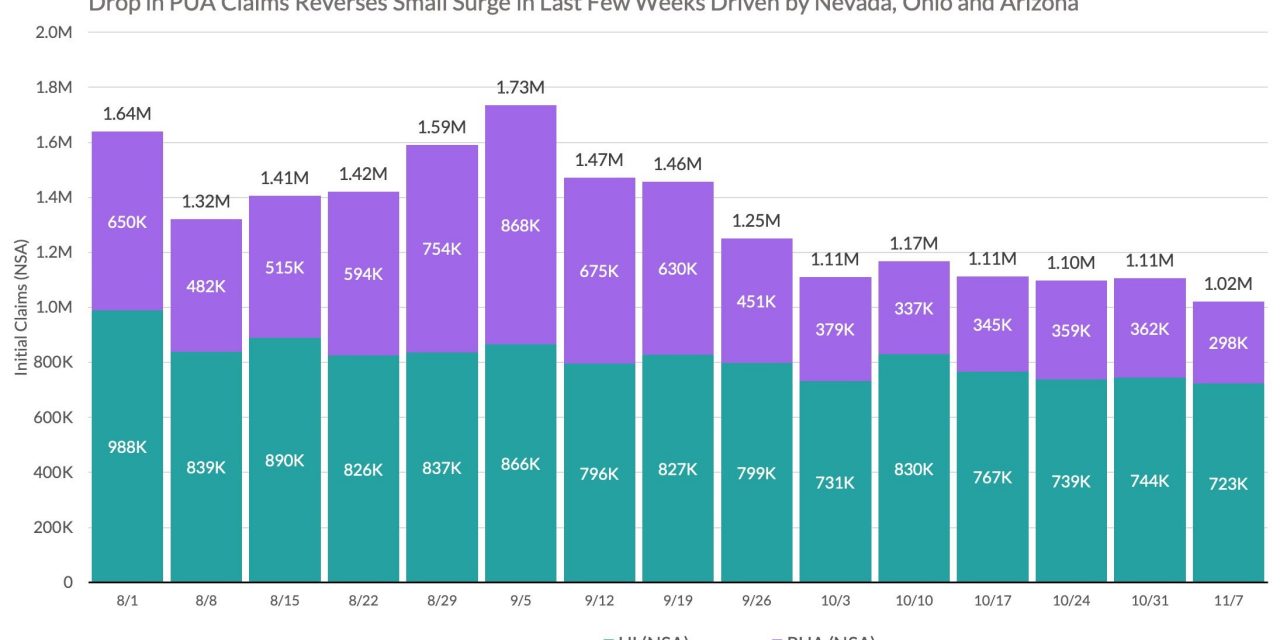
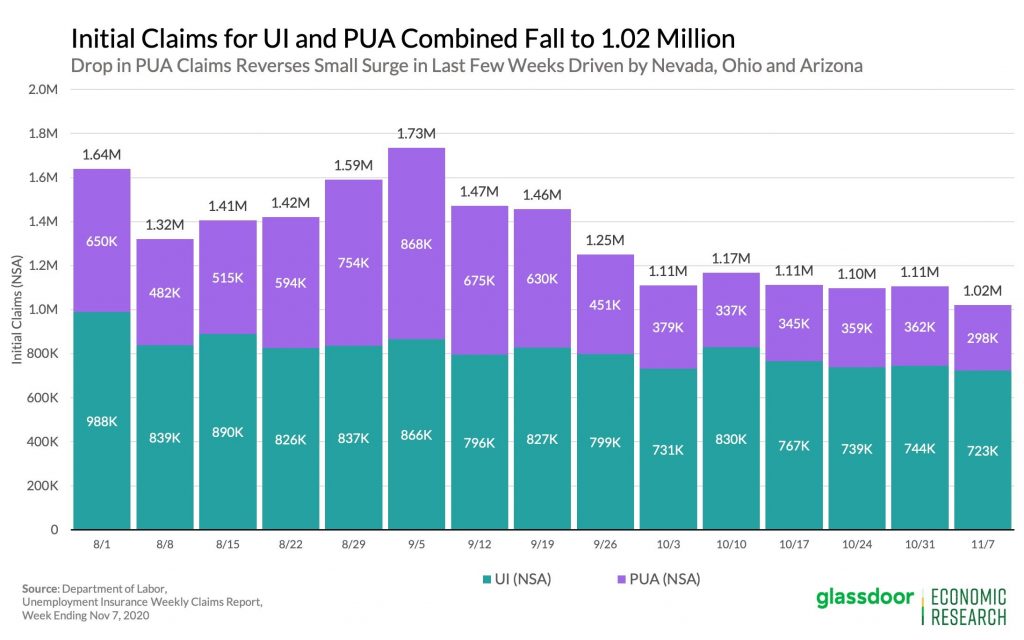
In the week of November 7th, seasonally adjusted initial claims fell from 757,000 to 709,000 which is a huge 48,000 decline. That was below the consensus of 737,000. Without PUAs, initial claims would normalize within a few weeks at that rate. Non-seasonally adjusted initial claims finally hit a new cycle low. They fell from 744,000 to 723,000. That is about 8,000 below the previous cycle low 5 weeks before.
PUAs fell 64,000 to 298,000. That means, combined with initial claims, they fell 7.8%. The states with the biggest declines in PUAs were Nevada (-32,000), Ohio (-18,000), and Arizona (10,000). Remember, Nevada’s PUAs had been too high. The labor market didn’t improve. The data got more accurate. Obviously, PUAs are very volatile, but it’s impressive to see jobless claims continue to fall even as COVID-19 is ravaging the country. This makes it seem like the virus won’t hurt the labor market unless there are shutdowns. We wonder how long this can last with cases spiking and restrictions increasing.
Continued Claims Fall Again
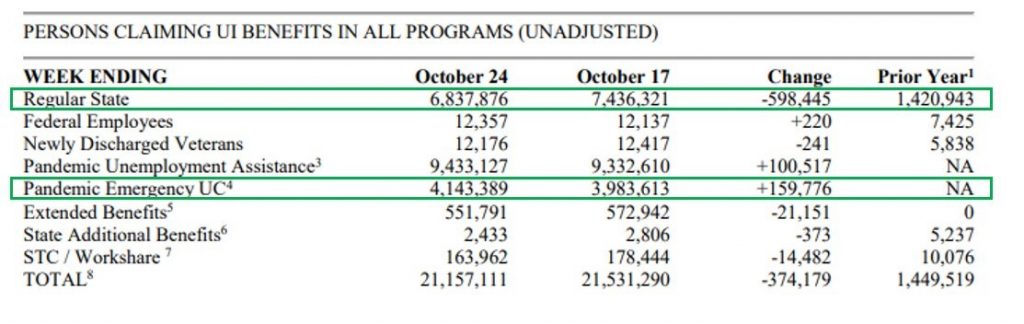
Continued claims fell from 7.222 million to 6.786 million in the week of October 31st. That 436,000 decline was the lowest since there was no change in the week of September 12th. However, there is less room for them to fall. If claims fell at this past week’s rate for 10 more weeks, they would be back to normal. In the week of October 24th, PEUCs rose 160,000, but extended benefits fell 21,000 which means the total number of people on benefits fell again. Continued claims were down 598,000 that week. The total, including all the various programs, was a net decline of 374,000.
The labor market is in a race against time. We need these people on pandemic claims to get their jobs back before the end of the year because the benefits will expire. COVID-19 is worse than it was in the summer and quickly approaching the spring peak. There are 13.5 million people on PEUCs and PUAs. That would be a massive number of people losing benefits in what could be the worst part of this pandemic.
Conclusion
CPI missed estimates. The Fed isn’t expected to raise rates until 2025 because inflation has been tepid and the Fed has a new policy. It wants the average inflation rate over the cycle to get to 2% before hiking. Healthcare inflation fell sharply. The jobless claims report showed a lot of improvement even though COVID-19 is spiking worse than the summer. The problem is there will still be over 10 million people on pandemic claims by the end of the year when benefits expire. If COVID-19 causes more shutdowns, you would think an extension would be enacted.
Have comments? Join the conversation on Twitter.
Disclaimer: The content on this site is for general informational and entertainment purposes only and should not be construed as financial advice. You agree that any decision you make will be based upon an independent investigation by a certified professional. Please read full disclaimer and privacy policy before reading any of our content.


