UPFINA's Mission: The pursuit of truth in finance and economics to form an unbiased view of current events in order to understand human action, its causes and effects. Read about us and our mission here.
Reading Time: 4 minutes
In the week of June 26th, initial jobless claims fell from 415,000 to 364,000 which was below estimates for 395,000. It pushed the 4 week average down to 392,750. It is about double normalcy. There were 115,000 new non-seasonally adjusted pandemic initial claims. This will quickly become an irrelevant stat because the pandemic benefits are going away. As you can see from the map below, 8 states ended their pandemic benefits in the week of June 19th and 10 states ended them in the week of June 26th.
In the week of June 12th, there were 14.66 million people still on all benefits programs. Continuing claims in the week of June 19th actually were up 46,000 to 3.469 million. That’s about double where they were before the pandemic. It’s now or never for people to get jobs. There are record job openings, the pandemic is over in America, and the pandemic benefits are going away.
Challenger Job Cuts Fall To A 21 Year Low
Once again, we have another labor report that is screaming about how great the labor market is doing. As you can see from the chart below, in June job cut announcements fell 16.7% sequentially. They are down 88% yearly. This is the lowest reading in 21 years. That’s dramatically different from the jobless claims report and similar to the job openings report.
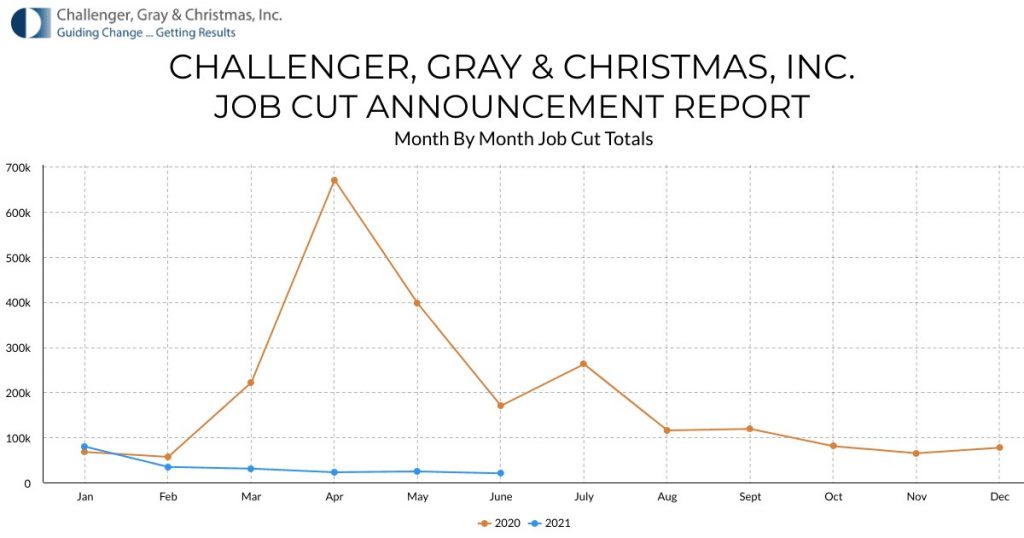
There have only been 212,661 cut announcements in the year which is an 87% decline from the first half of 2020. Going back to 1989, there were only two years in which Q2 had lower cut announcement than this year. The population of America was much lower in 1997 and 1989. Further good news, there were 110,093 hiring announcements in June. That’s the highest since February and up from 49,118 in May. Furthermore, the June announcements were more than any other June since at least 2014.
Rents Are Coming Up
The cost of rent will increase dramatically in the next 6 months as cities fill back up and people go back to work in offices. The charts below show the projections for rents in 5 top cities which have gone wrong due to the pandemic. These predictions are basically just drawing a line that moves up and to the right. It’s impossible to get it right especially with a pandemic ruining everything. Now with incomes up and catchup price increases are coming, rent inflation is set to be very strong. We should see shelter inflation creep up in the June CPI report.
Off The High
The ISM manufacturing PMI was strong again. It’s off the 2021 high, but that was a given. It’s a positive for cyclical stocks and commodity prices if the ISM PMI can stay at least above 55. In June, the PMI fell 6 tenths to 60.6. As you can see in the chart below, new orders were down 1 point to 66. The production index was up 2.3 points to 60.8.
The prices index was ridiculously high. It was up from 88 to 92.1. That’s a record high going back to 1979. That goes against the narrative that inflation is peaking. The best part of the report was the signal that the supply chain is normalizing. The backlog of new orders index was down 6.1 points to 64.5 points. The supplier deliveries index was down 3.7 points to 75.1. Those are elevated readings, but it’s good to see them off their highs.
This was the 5th straight PMI above 60. This has been an amazing run. That streak will end soon. However, as long as it stays above 55, we should be fine. We’re looking for some sort of slowdown next year. The economic momentum following the pandemic will be gone and central banks will be more cautious. This GDP report is consistent with 5% GDP growth. Obviously, the economy can’t grow that high for much longer. The long term growth rate is slightly above 2%.
A transportation equipment company stated, “Strong sales continue, and production output is at 100 percent. COVID-19 restrictions have been mostly lifted. Global chip allocation continues to limit some feature offerings — production schedules have been updated to restrict content affected by the chip shortage.” This chip shortage should be somewhat alleviated by the end of the year. The SOXX semiconductor ETF is only up 1.9% since February 16th. That’s a big deal for this once extremely hot index. It probably won’t have a good 2nd half with the supply/demand situation coming in balance.
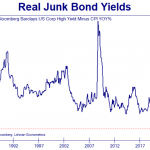
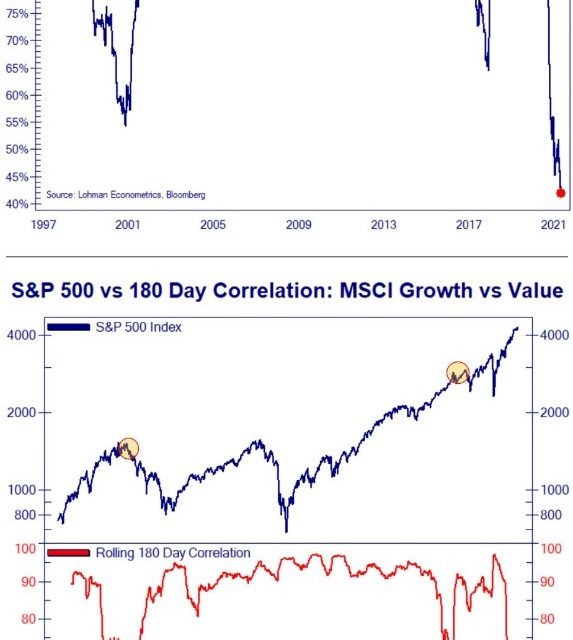
Crazy Relationship
We are back to the crazy relationship between value and growth stocks. Many growth stocks had very great summers in 2020. Then, in the fall right before the positive vaccine data came out, value stocks sold off sharply. Then, from early November to a few weeks ago, value stocks were on fire. Growth stocks peaked again in February. They were having a weak 2020 until a few weeks ago when everything shifted. Starting about 6 weeks ago, the growth stocks have rallied incredibly hard, while value stocks have underperformed.
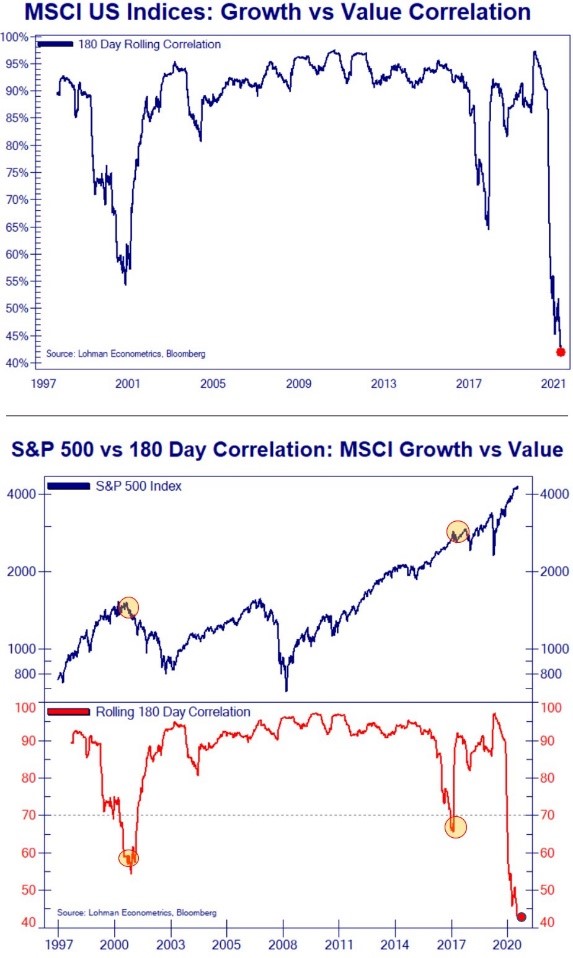
From May 12th to July 1st, the Nasdaq 100 rallied 11.89% which is about a year’s worth of returns in a little more than a month in a half. Growth stocks are very overbought. In that period, the Dow is up 3.11% and the small cap Russell 2000 is up 6.06%. Those actually aren’t terrible returns. However, the small cap value index would be much closer to flat if the meme stocks weren’t in the index.
As you can see from the chart above, the 180 day correlation between value and growth is at a record low. The fact that it much lower than the 2020 trough is amazing because the economy is close to its normal state other than there still being a lot of pent up demand. The economy is way closer to normal than it was last year.
Conclusion
Jobless claims keep falling. Job cut announcements hit a 21 year low. Rent prices missed pre-pandemic estimates, but they’re coming back quickly. The ISM PMI fell slightly, but it’s still in a 5 month streak above 60 which is impressive. That won’t last much longer. Value stocks have been doing okay recently, while growth stocks have been on an intense run higher. Growth stocks are due for a correction.
Have comments? Join the conversation on Twitter.
Disclaimer: The content on this site is for general informational and entertainment purposes only and should not be construed as financial advice. You agree that any decision you make will be based upon an independent investigation by a certified professional. Please read full disclaimer and privacy policy before reading any of our content.