UPFINA's Mission: The pursuit of truth in finance and economics to form an unbiased view of current events in order to understand human action, its causes and effects. Read about us and our mission here.
Reading Time: 4 minutes
As the yield curve steepens, calls for a recession are growing because usually after yield curve inversions, steepening is coincident with recessions. The 10 year 3 month spread has gone from inverted by about 50 basis points to slightly positive. Firstly, that’s not enough to be consistent with a recession if this indicator is accurate. More importantly, this can be a bullish steepening. The curve inverted because investors were very bearish on nominal growth. The long bond yield fell significantly. If the long yield increases, it means investors are becoming more bullish on nominal growth. That would also steepen the curve, but it obviously wouldn’t be problematic.
On the one hand, the Fed hiked rates into a slowdown in 2018. On the other hand, it wasn’t the hiking that caused the inversion (Fed controls near term rates). The Fed was correctly in the easing mode when the inversion occurred this year. The Fed has significantly eased while the US economy still isn’t in a recession. If the Fed’s rate cuts have a positive effect on the economy in a lagged fashion, causing expected growth to rise, the yield curve will normalize.
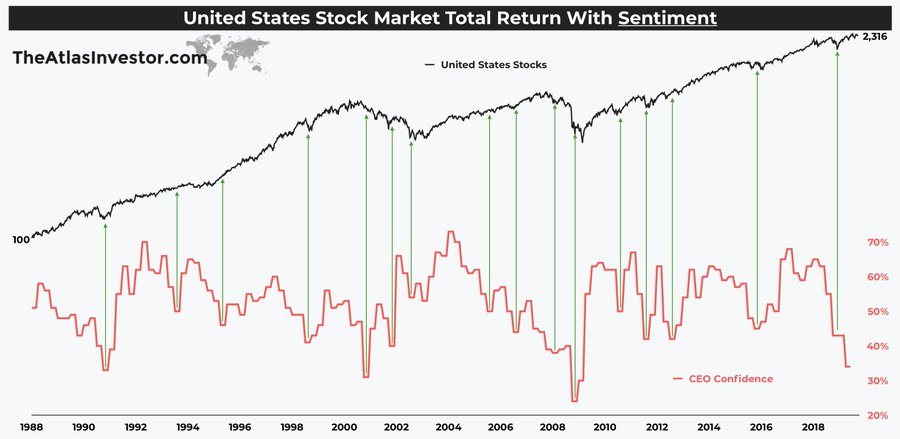
Is CEO Confidence A Good Indicator For Investors?
There always seems to be a new popular bearish chart that explains why a recession and bear market are coming. Be careful of these new signals when most traditional indicators don’t comply. It’s not great to see CEOs very bearish on the economy since they impact capex plans, but at the same time the ratio between the leading and coincident indexes isn’t signaling a recession, jobless claims are low, and consumers are confident.
The chart below compares CEO sentiment with the total returns in US stocks.
CEOs are often bearish at the bottom in stocks. CEOs aren’t alone as investors are currently also bearish. Compared to how well stocks have performed recently, CEO bearishness is excessive. It’s clear management teams are bearish because of the combination of the trade war and cyclical slowdown. This explains why confidence fell below the prior slowdowns even though growth may not be as bad. That doesn’t imply a recession though. Many investors give too little credit to the cyclical slowdown. Even with a worsening trade war, there are ways to avoid a recession.
Stocks Do Better With A Weak Manufacturing PMI
It’s counter intuitive for bearishness among CEOs to be a positive for stocks. Similarly, the chart below shows when the ISM manufacturing PMI is below 50, it’s a good sign for future S&P 500 returns.
The 1 year return is 13.29% with a PMI between 29.4 and 50, while returns are 6.97% with the PMI from 50 to 77.5. The logic behind this is stocks price in the weakness before this report shows contraction. For example, if the PMI starts at 60 and bottoms at 45, most of the decline has already occurred by the time it falls below 50.
The manufacturing sector has been weak for a while now. Everyone knows about the manufacturing slowdown. On the other side, everyone knew about the global cyclical expansion in 2017. Once it showed signs of weakening in early 2018, markets peaked. You can’t just sell stocks because of bad news. You must consider what the consensus expects first.
Extremely Low Expected Inflation
Fewer consumers discussed the trade war in the University of Michigan sentiment report because they aren’t seeing overall inflation. We’re not saying the trade war isn’t a negative factor on GDP growth. However, if consumers expect the lowest inflation in 30 years, price increases aren’t exactly a big fear. The expected inflation rate in the next year fell 0.3% to 2.5%. As you can see from the chart below, the expected inflation rate in the next 5-10 years fell 0.2% to 2.2% which is the lowest rate since at least 1989.
Another Negative Yearly Growth Reading For Cass Freight Shipments
Opinions differ on the September Cass Freight index. The trend appears to be in the eye of the beholder. Some say shipment volumes are up 3 months in a row for a pace of 9.7% annualized growth. Other continue to point to the negative yearly growth seen in the chart below. In September, yearly growth was -3.4%. That follows yearly growth of -3% and -5.9% in the prior 2 months.
Cass Information Systems continues to warn about negative yearly real GDP growth later this year. That’s similar to the soft data, but different from the hard data. Yearly expenditures growth was similarly weak as it was -4.5%. That’s down from -2.6% in August and -1.4% in July. On the positive side, the 2 year growth stack in the shipments category improved from 2.8% to 4%. Growth was very strong in September 2018. The comps get much easier in the next 2 months as yearly growth in 2018 went from 8.2% in September to 6.2% and 0.6%.
Conclusion
The yield curve steepening might not be signaling a recession. It could just mean the Fed is cutting rates to deal with the slowdown, which in turn is boosting nominal growth expectations. Easing global central banks could catalyze a global upturn. CEOs have been bearish near market bottoms. When the manufacturing PMI is below 50, stock returns are actually above average. The bear market checklist shows there’s little reason to fear a bear market. That being said, the checklist isn’t perfect. Cass Freight shipments growth was negative on a yearly basis, but with easier comps coming, growth might be positive by November.
Have comments? Join the conversation on Twitter.
Disclaimer: The content on this site is for general informational and entertainment purposes only and should not be construed as financial advice. You agree that any decision you make will be based upon an independent investigation by a certified professional. Please read full disclaimer and privacy policy before reading any of our content.


