UPFINA's Mission: The pursuit of truth in finance and economics to form an unbiased view of current events in order to understand human action, its causes and effects. Read about us and our mission here.
Reading Time: 4 minutes
Shakespeare stated “To be, or not to be” in Hamlet. We say, ‘to raise, or not to raise (year end price targets).’ It’s always interesting to see year end price targets for the S&P 500 changed a few weeks into the year. The question is if firms making the changes in the first few weeks of the year are doing so in response to data or stock market moves. Investment firms don’t like to be caught bearish. Since many called for mid-single digit price gains, the rally to start the year is tempting some to raise their targets already. It makes far more sense to have continuous short and intermediate term predictions instead of targets based on the calendar, but the latter gets way more attention in the media especially at the start and end of the year.
Credit Suisse raised its 2020 S&P 500 price target from 3,425 (3.1% gain) to 3,600 (8.4% gain). That’s a significant change as returns for the year go from the mid-single digits to the low double digits when you include current year to date gains. Credit Suisse’s estimates imply EPS growth of 6.2% which is above 2019’s estimated growth of 1.1%. The kicker is the firm expects forward multiples to increase from 18.9 to 19.6. We included their analysis especially because the chart above is unique. It includes estimate beats added to the current EPS growth estimates. It probably also includes the usual estimate decline as results get closer since FactSet shows the current consensus estimate is for 9.5% growth. Therefore, with a cyclical upturn, it’s not aggressive to call for such a growth rate.
The aggression comes from calling for multiple expansion instead of multiple contraction. It’s very easy to react to recent momentum by raising the expected multiple, but why should the multiple increase? Multiples increased in 2019 because of the anticipated economic acceleration and Fed rate cuts. There is currently only a 58% chance of 1 cut this year. Stocks actually perform worse when the ISM manufacturing PMI is above 50 than below 50. If you believe in a cyclical expansion that will help earnings growth, there might be limited upside once it occurs. With the improvement in the Philly and Empire Fed reports in January, the ISM PMI could rise above 50 as early as January.
Political Tail Risk
Within the January Bank of America fund manager survey, the most crowded trade is said to be long U.S. tech and growth. Conversely, when asked for their actual positions, the z-score of commodities was 0.9 which was the highest. Tech was in 7th place with a z-score of about 0.4. This obviously, doesn’t mean tech isn’t overvalued. Maybe fund managers are avoiding it because of its great rally. The 14 week RSI of the XLK, which is the tech sector in the S&P 500, is at 82 for only the 5th time since 1990. The other 4 readings were all in the 1990s tech bubble. The good news is only one reading was near the top.
As you can see from the bottom chart below, global fund managers believe the biggest tail risk is the 2020 U.S. election.
Market returns having fat tails mean there are more returns outside of the normal bell curve than expected. The 2020 election is said to be capable of providing outsized losses. The question keen observers usually have is if everyone can see a risk coming, how can it provide tail risk in the first place? In this scenario, just because everyone knows the election will happen, doesn’t mean the market has priced Sanders winning (which might be a negative event for markets).
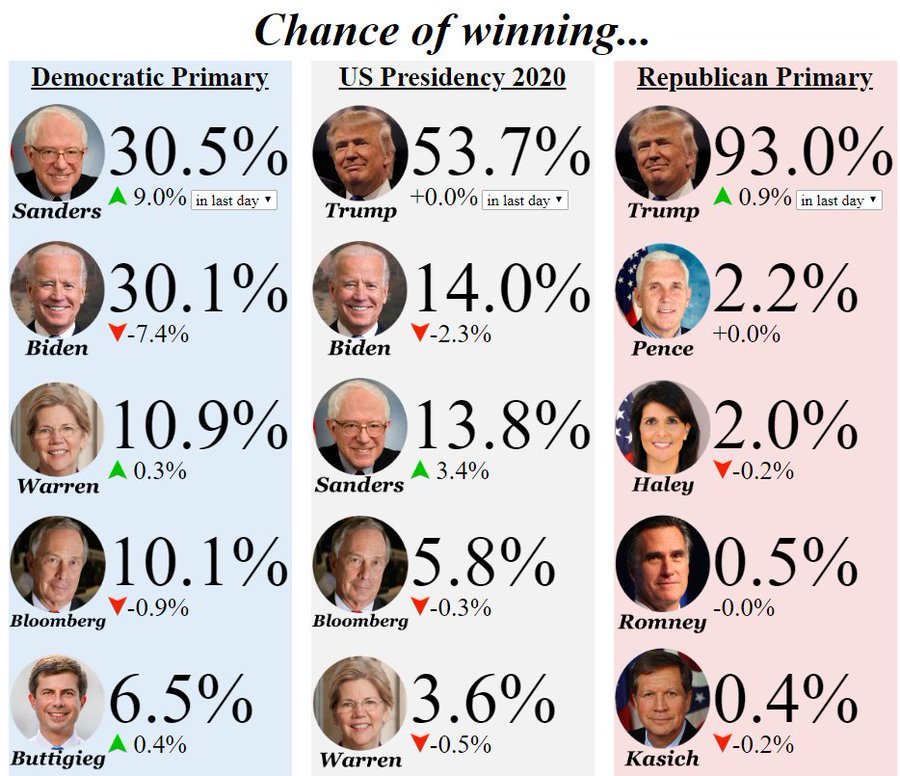
As you can see from the graphic below, Sanders has recently surged ahead in the odds market as he has a 30.5% chance of winning the primary and Biden has a 30.1% chance. To be clear, just because the betting market shows this doesn’t mean the bond and stock markets expect him to win.
The Iowa caucus is on February 3rd. The latest 2 polls have Biden ahead by 6 points. He averages a 3.7 point lead in the recent polls. Sanders has a 1.3 point lead over Biden in New Hampshire which has its primary on February 11th. In the latest 3 national polls, Biden is up by 5 and 7 points over Sanders and Sanders is up on Biden by 3 points. The CNN poll with Sanders ahead swung the odds on Wednesday. The average of recent polls has Biden only up by 6.1%.
Where Is The Euphoria?
While stocks have done well recently, as the number of weekly new highs on the NYSE and Nasdaq combined is the highest since Janaury 2018, the Bank of America survey suggests there isn’t euphoria yet. As you can see from the chart below, the net percentage of asset allocation that is overweight equities isn’t yet near the percentage consistent with market tops.
Furthermore, the chart below shows the net percentage of managers who are overweight U.S. equities has fallen from the high teens to the low single digits. That’s while America’s performance continues to trounce the rest of the world in the intermediate term.
Stocks Predict A Rise In Job Openings Growth
The number of job openings in November fell from 7.361 million to 6.8 million, but the scenario is far from a disaster as the number of hires rose from 5.782 million to 5.821 million. Hiring is more important than a job opening because people actually getting a job matters more than a job opening that might go unfilled. Yearly openings growth fell from -3.8% to -10.8% which is the lowest growth rate since December 2009. Hiring growth rose from -1.6% to 0%. Earnings lead job openings by about 2 months. Both have been weak. As was shown in the first chart of this article, many are predicting an earnings recovery. The stock market certainly is with its rally. As you can see from the chart below, the stock market is also predicting a recovery in job openings growth as the S&P 500 leads openings by 7 months.
Conclusion
It’s always interesting to see how quickly end of year estimates react to price changes. Investment firms especially don’t want to be caught being bearish on stocks. The most crowded trade is long U.S. tech and growth and the most prominent fat tail risk is the U.S. election according to investors. The betting market suggests Bernie has higher odds than we think equity and bond markets are pricing in. Bernie winning would be a fat tail risk. Investors aren’t at euphoric levels of asset allocation and firms are pairing down their overweight exposure to U.S. stocks. Finally, the stock market is predicting a recovery in earnings and job openings growth.
Have comments? Join the conversation on Twitter.
Disclaimer: The content on this site is for general informational and entertainment purposes only and should not be construed as financial advice. You agree that any decision you make will be based upon an independent investigation by a certified professional. Please read full disclaimer and privacy policy before reading any of our content.


