UPFINA's Mission: The pursuit of truth in finance and economics to form an unbiased view of current events in order to understand human action, its causes and effects. Read about us and our mission here.
Reading Time: 4 minutes
Stocks Versus Treasuries
The most interesting action in markets is the relationship between stocks and treasuries because stocks are acting as though the economy is ready to rally higher, while treasuries are showing bond investors expect growth to decrease. On Friday, when the S&P 500 increased 0.5%, it surpassed a key resistance area which was slightly above 2,800. It is now up 12.59% year to date; it’s 3.8% away from hitting a new record high. Stocks are rallying on the hope that the service sector will be strong. Manufacturing weakness can’t take down the whole economy.
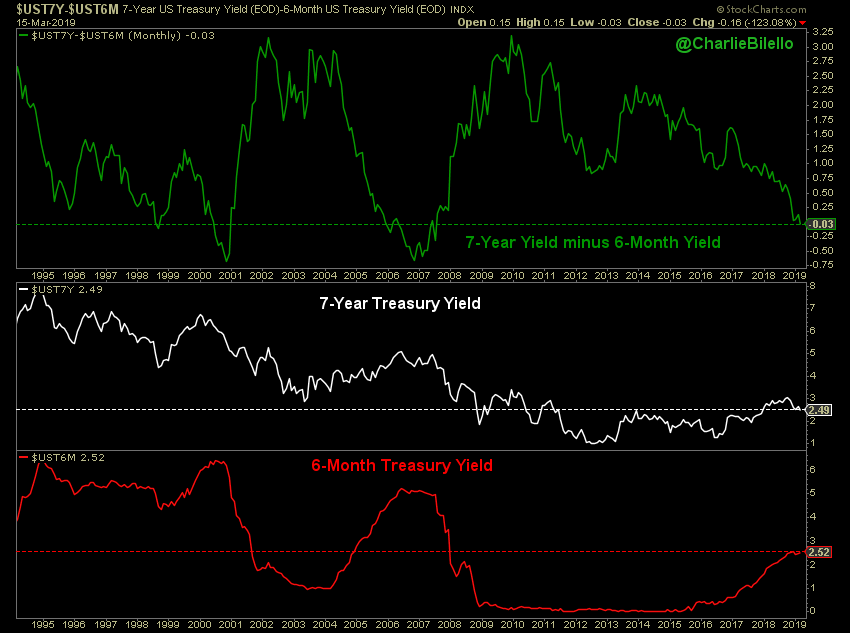
The treasuries market has rallied significantly this year as the 10 year yield has fallen to just 2.59% which is 5 basis points above its 52 week low. It has fallen 65 basis points from its peak in early November. Now it is only 19 basis points above the Fed funds rate. Bond investors are pushing the Fed towards rate cuts as the Fed funds futures market shows there is a 30.3% chance the Fed cuts rates at least once this year. The yield curve has been flattening lately. As you can see from the chart below, the difference between the 7 year treasury yield and the 6 month yield is -3 basis points as that part of the curve has inverted. Last cycle that inversion occurred in late 2005, making it about 2 years before the next recession.
Weekly Leading Index Is Improving
The ECRI leading index was early to call for the current economic slowdown as the index’s yearly growth was negative last fall. To be clear, the U.S. economy is in a slowdown as the median of Q1 GDP growth estimates is 1.4% (per CNBC). That’s subject to change, but models have plenty of data from January and February to make good predictions.
As you can see from the chart below, the ECRI leading index’s growth rate has been spiking recently partially because of easy comparisons.
In the week of March 8th, the leading index’s growth rate improved from -3.7% to -2.9%. While that’s still indicating economic growth will be weak in the next 2-3 quarters, it’s much better than the yearly growth rate of -6.7% in the first week of the year which was a 7 year low. If the growth rate had fallen any further, it would have been similar to the declines prior/during many recessions. The economy may have narrowly missed a recession as the ECRI leading index troughed at a lower growth rate than in 2015-2016 (the last slowdown).
Broader Earnings Weakness
According to FactSet, S&P 500 Q1 earnings growth is expected to be -3.6%. Since estimates will likely fall in the next few weeks before the heart of earnings season gets underway, earnings growth will be negative even if estimates are soundly beaten. The positive aspect of this earnings decline is revenues are expected to be up 4.9%. If revenues grow, we don’t think it’s fair to call this an earnings recession. Just because this isn’t an earnings recession yet doesn’t mean the weakness should be ignored. As you can see from the chart below, the decline in profits in Q1 will be in 8 sectors while the decline was only in 4 sectors in 2015.
Energy was more responsible for the earnings weakness in the 2015-2016 earnings recession.
Weak February Industrial Production
As we mentioned earlier, the manufacturing sector is weak. It’s not as bad as the slowdown from 2015 to 2016, but it’s much weaker than it was in 2018 when the sector was firing on all cylinders. We shouldn’t be surprised by the weak February industrial production report because the ISM and Markit surveys showed growth weakened.
Monthly industrial production growth was 0.1% which missed estimates for 0.4% growth. Yearly industrial output growth was 3.5% which is down from above 5% growth 6 months ago. Manufacturing activity fell 0.4% monthly and only increased 1% yearly. Monthly growth was expected to be +0.4%. Monthly utility output was up 3.7% which means weather patterns helped boost growth. Mining was up 0.3% monthly and 12.5% yearly. The capacity to utilization rate fell from 78.3% to 78.2% which missed estimates for 78.5%. The chart below breaks down the 3 month moving average of the yearly growth rate in key end use markets.
Oil and gas extraction was a big growth engine, while apparel was the biggest decliner.
Consumer Sentiment Improves In March
The U.S. economy needs the consumer to be strong since industrial production growth is weakening quickly. The University of Michigan preliminary consumer sentiment index improved in March from 93.8 to 97.8. That beat estimates for 95.2. It was also above the high end of the estimate range which was 96.7. The government shutdown temporarily suppressed consumer confidence in January and February. The expectations index increased almost 5 points to 89.2 which was its best reading since October. The rising stock market helped this index. Current conditions were up almost 3 points to 111.2 which is the best reading since before the shutdown in December.
The chart below has a very negative viewpoint of this relatively great report.
The year over year change in the current conditions index is extremely negative. There have only been 3 times where it was down worse and there wasn’t a recession. Even the weak link that is industrial production, doesn’t signal a recession is afoot, so this might be another false red flag.
Households in the top 3rd of the income distribution were less optimistic than the overall index. This makes sense because they have seen less wage growth recently than the bottom income earners. As you can see from the chart below, those saying it is a good time to buy a house and car have been falling.
We think since the consumer has excess savings, inflation is modest, wages are accelerating, interest rates have fallen, and home prices are increasing at a slower rate, the housing market will have a solid spring selling season. Auto sales might not recover as much because of the secular weakness in the industry as micro mobility apps increase in popularity, something we pointed out previously.
Conclusion
Treasuries and stocks are rallying. Parts of the yield curve have inverted which means a recession could occur in 2020 or 2021. Q1 earnings weakness is more broad based than the 2015-2016 earnings recession, but revenue growth is set to be positive. The February industrial production report was weak, but the March consumer sentiment reading improved. Consumer spending growth should be strong since the labor market is strong.
Have comments? Join the conversation on Twitter.
Disclaimer: The content on this site is for general informational and entertainment purposes only and should not be construed as financial advice. You agree that any decision you make will be based upon an independent investigation by a certified professional. Please read full disclaimer and privacy policy before reading any of our content.


