UPFINA's Mission: The pursuit of truth in finance and economics to form an unbiased view of current events in order to understand human action, its causes and effects. Read about us and our mission here.
Reading Time: 4 minutes
If you are investing for the short term, you are betting on investor sentiment. This is a bet on what will go in and out of style on the Wall Street fashion show. There is no reason to judge someone harshly for making this type of trade. We are all trying to make money. We aren’t trying to look good doing it. Sentiment indicators can be reliable, but ultimately the best measurement of sentiment is the earnings multiple.
Determining how much an investor is willing to pay for each dollar of earnings gives you a great idea of sentiment. For example, companies that sell one time products such as computer hardware tend to get lower multiples in relation to their growth than services companies such as software firms. That’s because confidence in a hardware company’s ability to keep coming out with new products people want to buy is lower than the confidence investors have in a software firm’s ability to keep customers. This conclusion leads us to the chart below.
Multiple expansion accounts for 40% of stock returns within one year. As we mentioned, there is nothing wrong with buying a company that’s cheap and selling it when it gets expensive. The market has wild swings which you can benefit from.
In the long term, performance has little to do with sentiment. 1% of year 10 returns are impacted by multiples, while 71% of returns are impacted by revenue growth. If you are worried that your stock fell sharply because the sector is out of favor or the company had 1 bad year, you can gain solace in the fact that in the long term, the fundamentals will win out. Don’t get confused by those who follow monetary policy that say business fundamentals don’t matter. They are what determines long term performance.
American States Opened Too Soon
The U.S. states in the west and the south that are seeing spikes in cases either opened too soon or didn’t take the proper precautions after they reopened. In California, the 7 day average of new cases has spiked from 3,357 on June 18th to 5,556 on June 29th. As you can see from the chart below, the states in the south and west with the biggest spikes in cases opened when they still had significant cases per million. They didn’t stamp out the problem. The countries in Europe listed below stamped out their cases which led to successful reopens. The good news is the 7 day average of deaths in America flat-lined instead of spiking. On June 19th, there were 664 deaths per day and on the 29th there were 594 deaths per day.
Hot Spots Seeing A Decline In Growth
We mentioned in a previous article that growth in these hotspots was likely to slow. We were correct; as you can see in the chart below, the states with the largest spikes in COVID-19 cases have seen modest declines in hourly employees working. The weak ones listed are California, Texas, Florida, Arizona, and the Carolinas. On the other hand, the states that had successful reopens in the northeast have continued to see improvement. The ones listed are New Jersey, Connecticut, and Rhode Island. These trends are likely to continue for the next couple of weeks until the south and the west get their virus cases under control.
The Number Of Firms Giving Guidance Falls Again
Q1 earnings season was widely considered to be a negative catalyst by the financial media, but it didn’t end up sending stocks lower. That’s because firms were expected to give bad results, however, they added in color on recent weeks which showed a turnaround. Typically, a firm said it had weak results in Q1 and will have even worse results in Q2, but from late March to April, sales fell at a lesser rate. That’s music to investors’ ears as they love when results go from terrible to less bad. Q2 will be the bottom in EPS; if improving trends continue, traders may not mind the weak results. On the other hand, stocks are much higher than 3 months ago, so it’s possible the higher expectations aren’t hit.
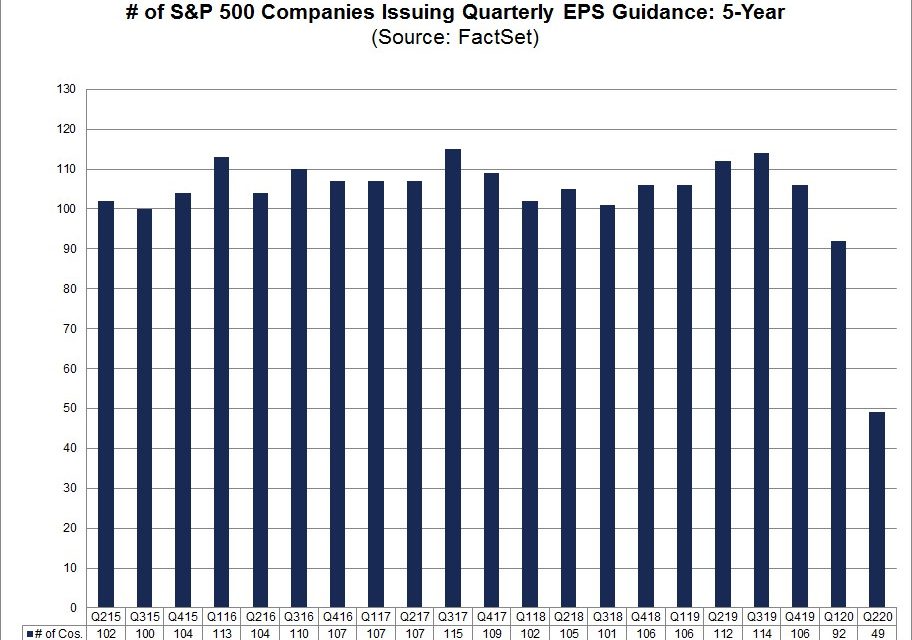
As you can see from the chart below, in the past 2 quarters very few firms have given guidance because of the added uncertainty of the virus.
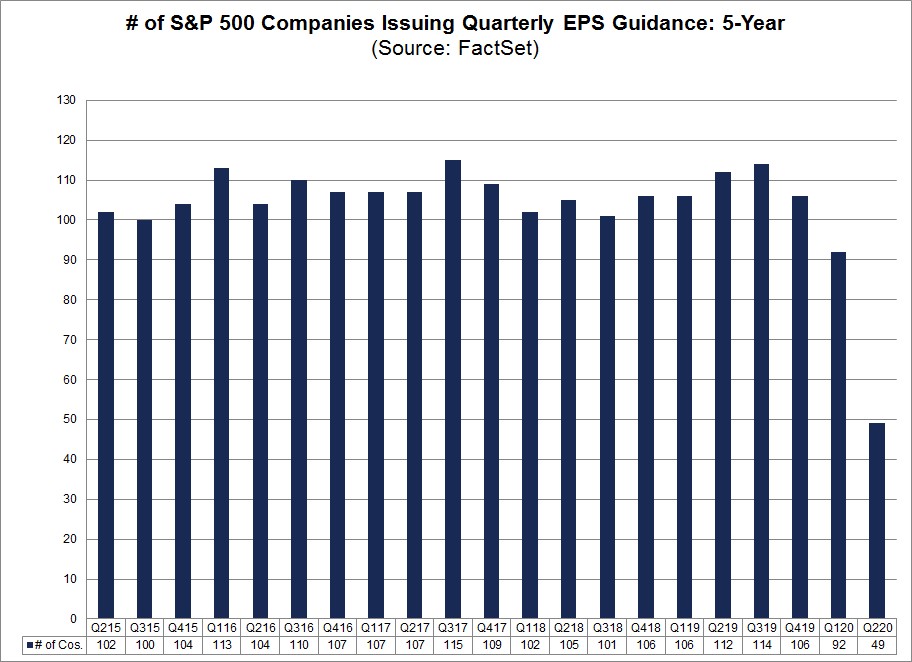
The 5 year average is 106 and only 49 gave quarterly guidance in Q2. The previous record low since 2006 had been 63. Because of survivorship bias, the firms that gave guidance were much more likely than usual to give good guidance. 22 gave positive guidance and 27 gave negative guidance. The 5 year average is 33 positive and 73.1 negative. The biggest outlier was consumer discretionary which had zero give negative guidance which below the 5 year average of 16.4. Results were so bad and uncertain, none gave guidance.
Election Risk
Stocks usually fall in the September and October before presidential elections when incumbents lose. You can think of that in two ways. Either the stock market falls because the economy is bad which in turn is bad for the odds of the incumbent winning or it means stocks fall because they anticipate the incumbent losing which increases uncertainty. There is a 61% chance Joe Biden wins which means stocks could selloff this September and October. However, because Biden is doing so well in the polls, the market might price it in now instead of later. Why wait to price in something viewed as a given? Obviously, it’s incredibly difficult to predict who will win. We’re just saying if traders are confident Biden will win, they should price it in now.
Conclusion
Stock prices are determined by sales growth in the long term. Sentiment doesn’t matter in the long term, but it does in the short term. The states in the south and the west that are seeing spikes in cases opened too soon. European countries opened after they had cases under control which is why they haven’t seen spikes. Very few firms are giving quarterly guidance which could lead to results beating or missing estimates more widely than usual. The stock market might selloff in the near term because Biden is winning in the polls as he wants to revoke Trump’s corporate tax cut. However, the Democrats still need to win Congress to get tax hikes enacted. Usually, the sitting President loses seats in congress in midterm elections,
Have comments? Join the conversation on Twitter.
Disclaimer: The content on this site is for general informational and entertainment purposes only and should not be construed as financial advice. You agree that any decision you make will be based upon an independent investigation by a certified professional. Please read full disclaimer and privacy policy before reading any of our content.


